Learn
Cytometry
Articles
Videos
About
Consulting
Articles
Videos
About
Consulting
42 Chapters — Free Access
From instrument fundamentals to AI-powered single-cell analysis. Updated May 2026.
Part I
Foundations
1
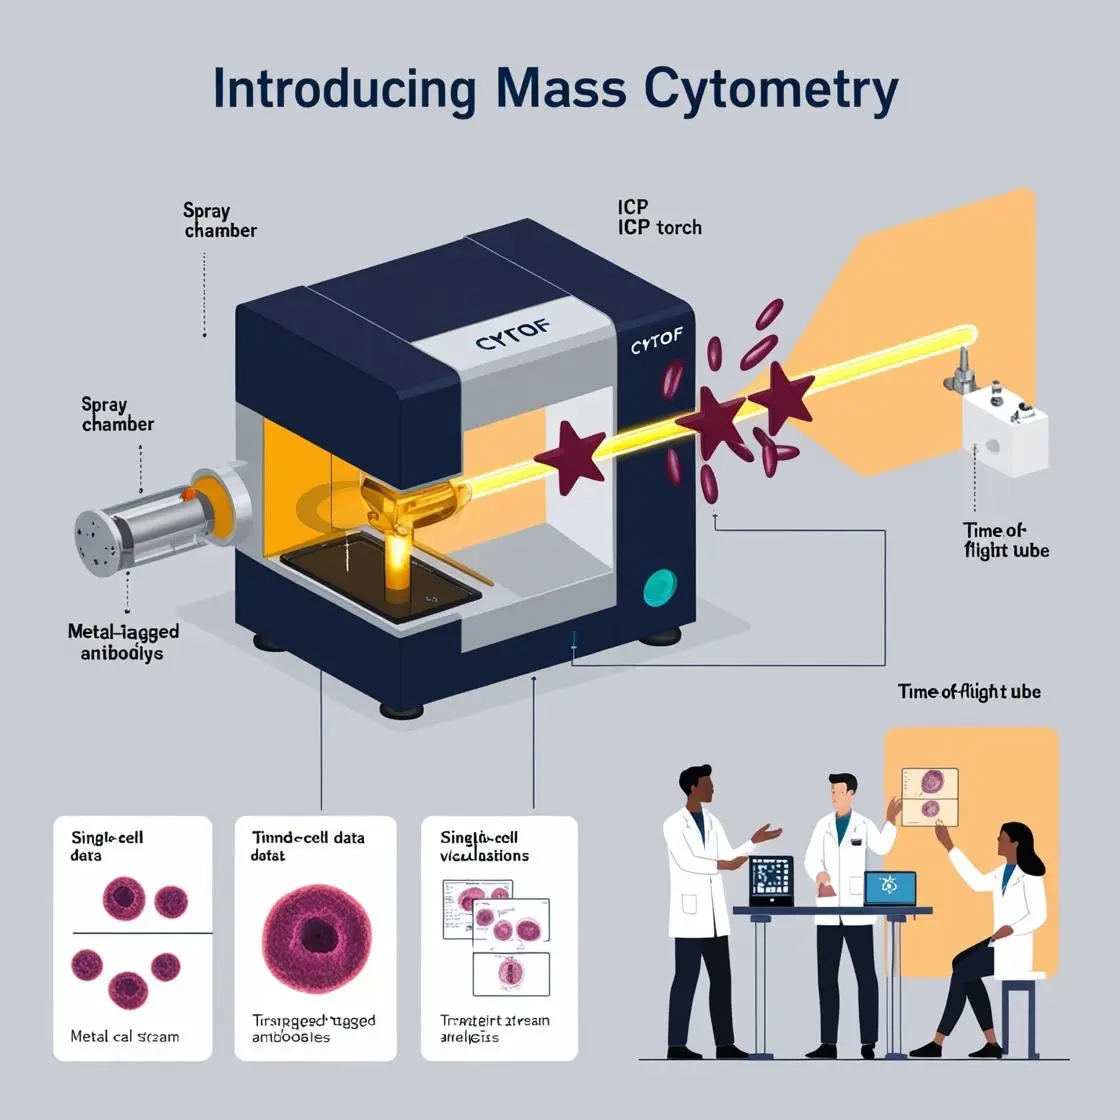
Introduction to Mass Cytometry
Updated May 2026
→
2
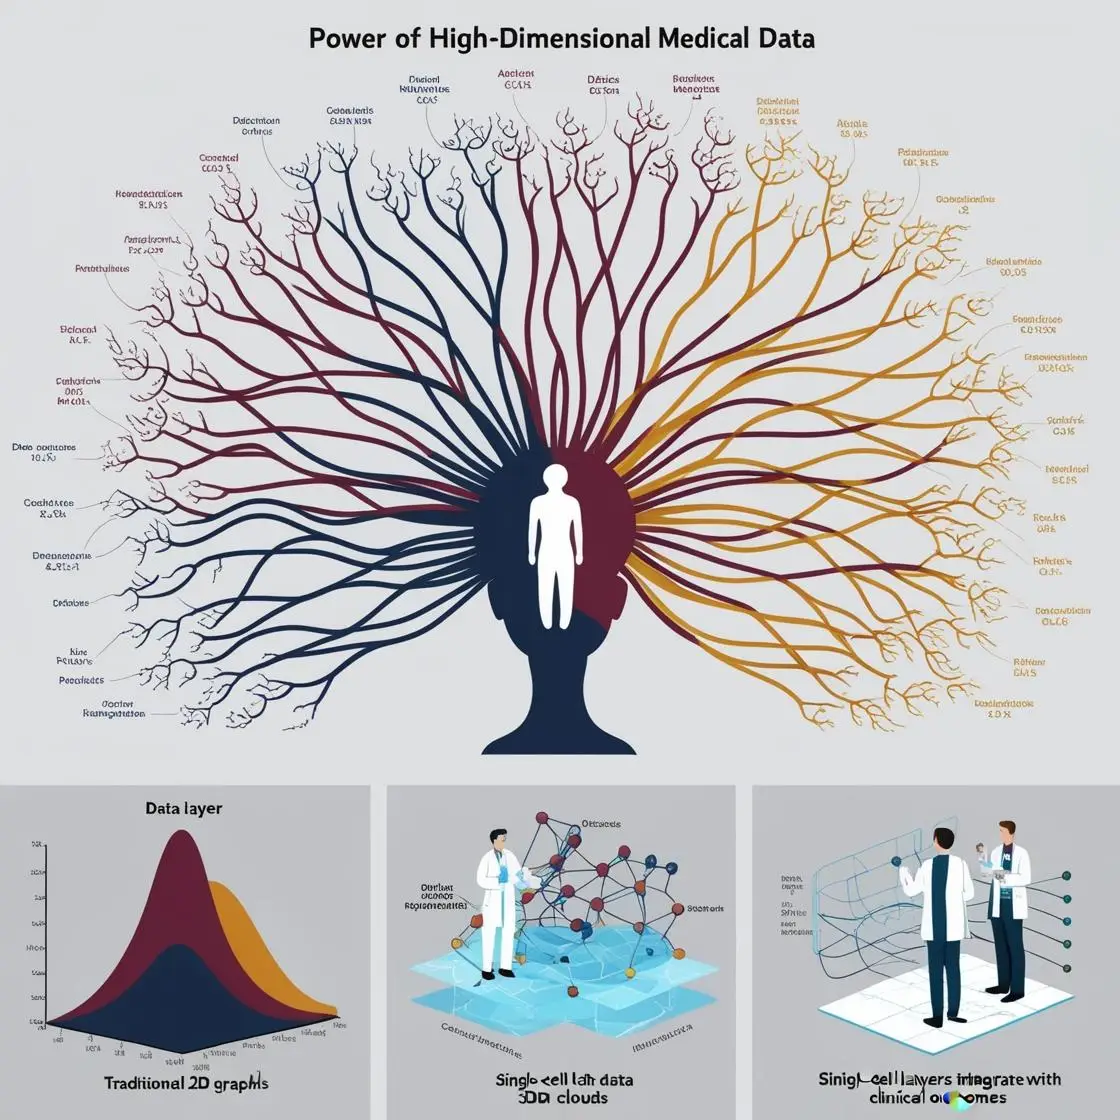
The Power of High-Dimensional Data
Updated May 2026
→
3
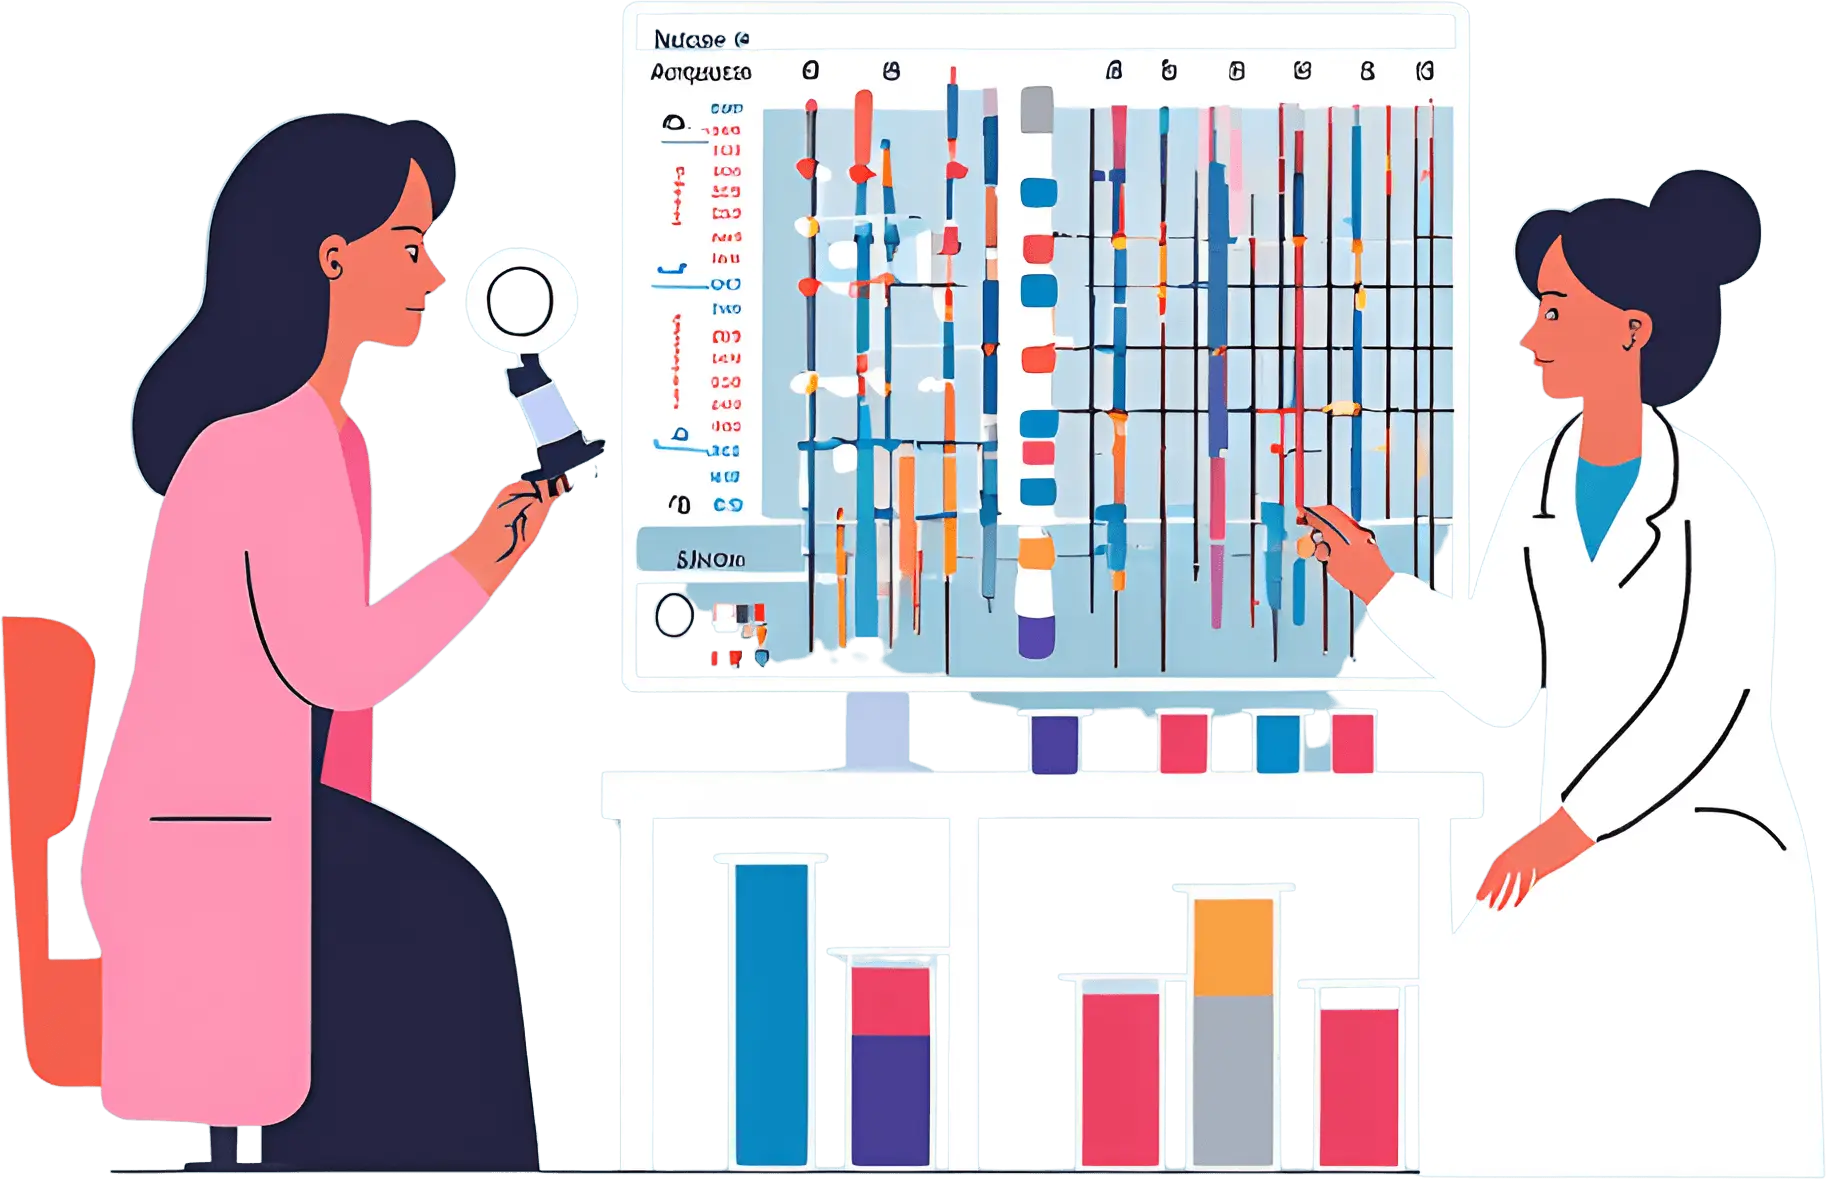
Single-Cell Analysis: A Paradigm Shift
Updated May 2026
→
4
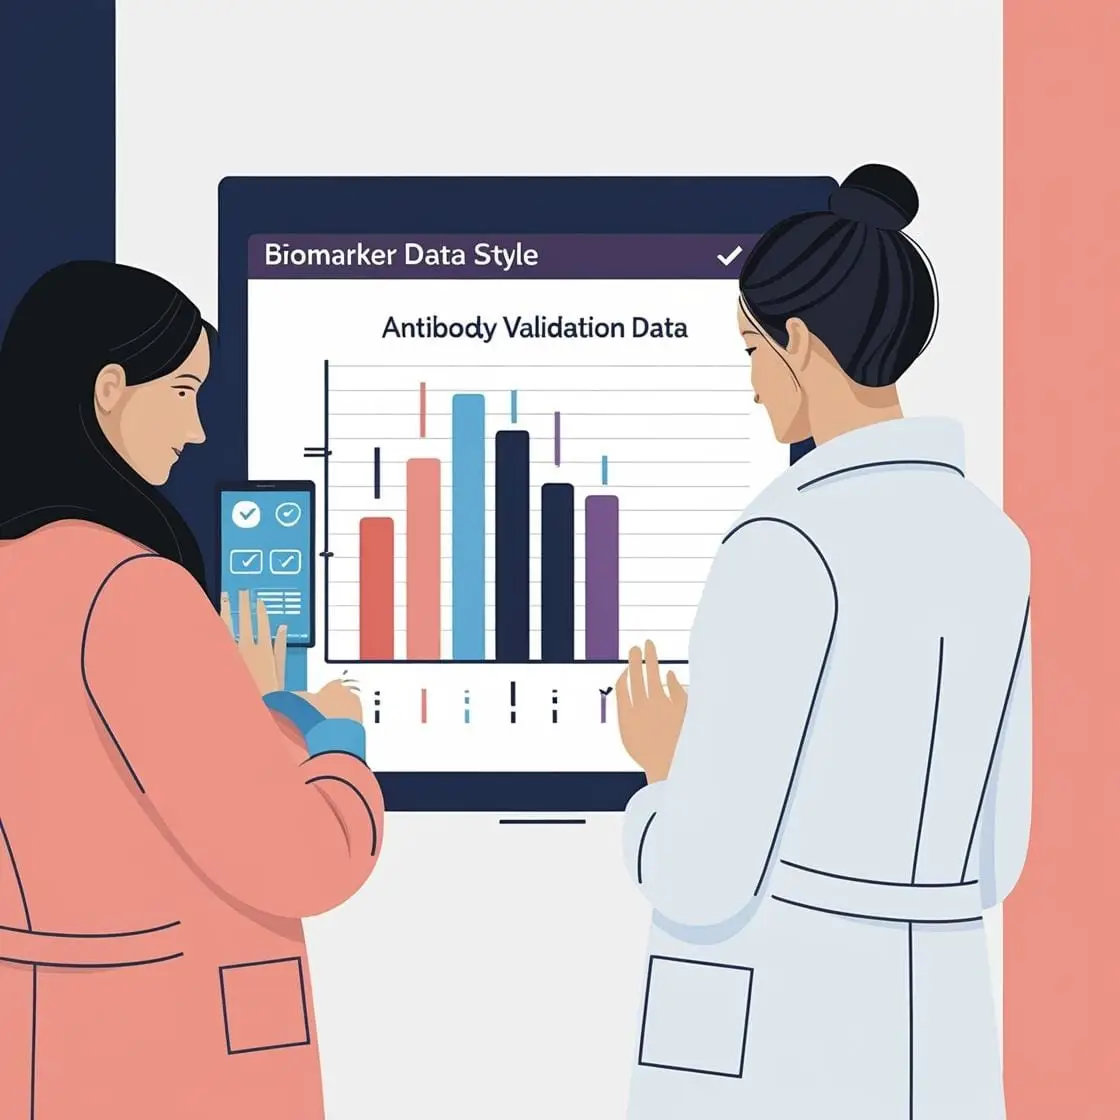
Biomarker Discovery and Validation
Updated May 2026
→
5
Panel Design for Mass Cytometry
Updated May 2026
→
6
CyTOF Instrumentation
Updated May 2026
→
7
Metal-Conjugated Antibodies
Updated May 2026
→
8
Sample Preparation Techniques
Updated May 2026
→
9
Quality Control in Mass Cytometry
Updated May 2026
→
10
Imaging Mass Cytometry (IMC)
Updated May 2026
→
Part II
Data Analysis
11
Introduction to High-Dimensional Analysis
Updated May 2026
→
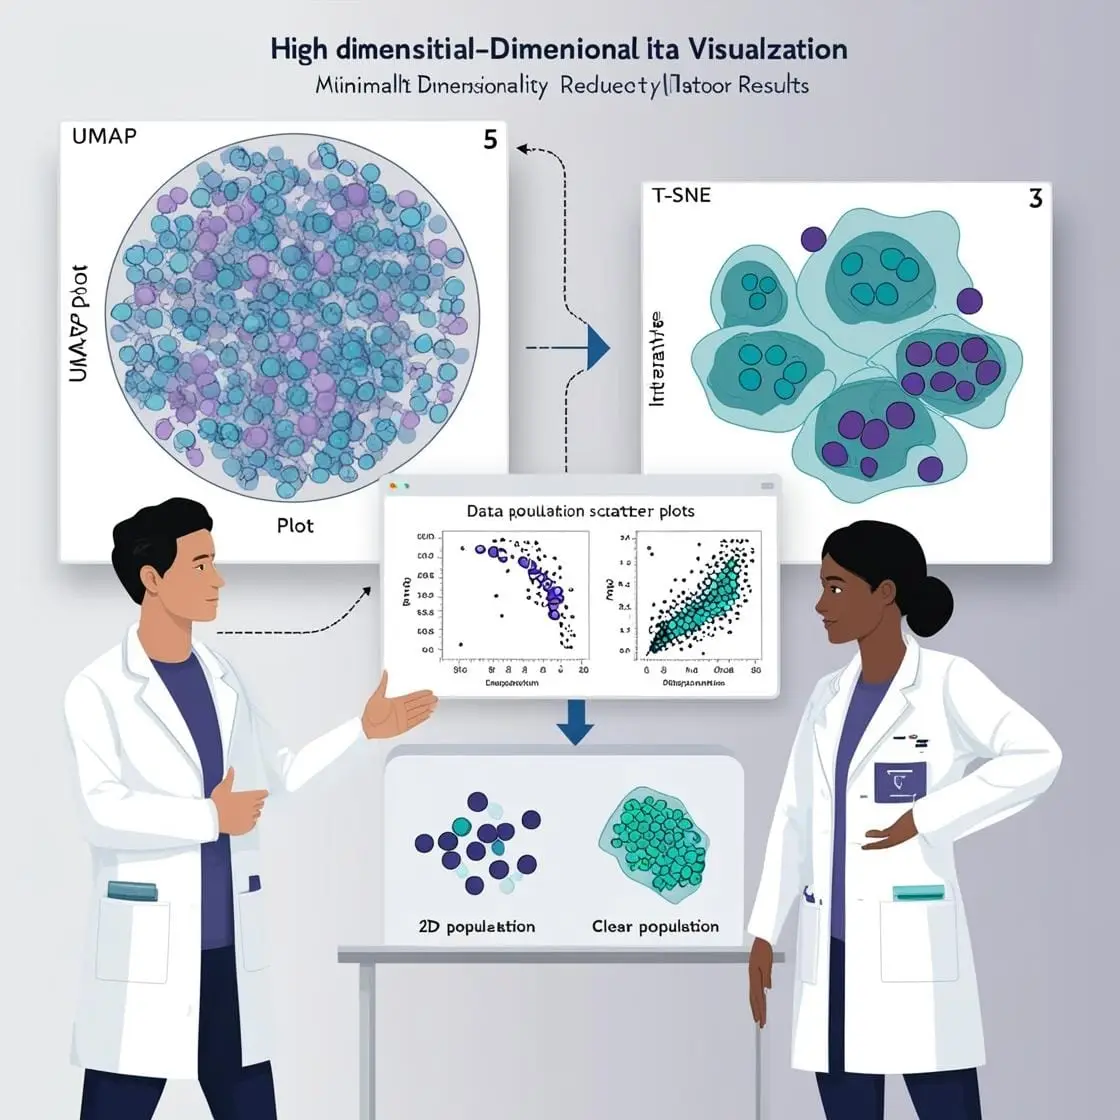
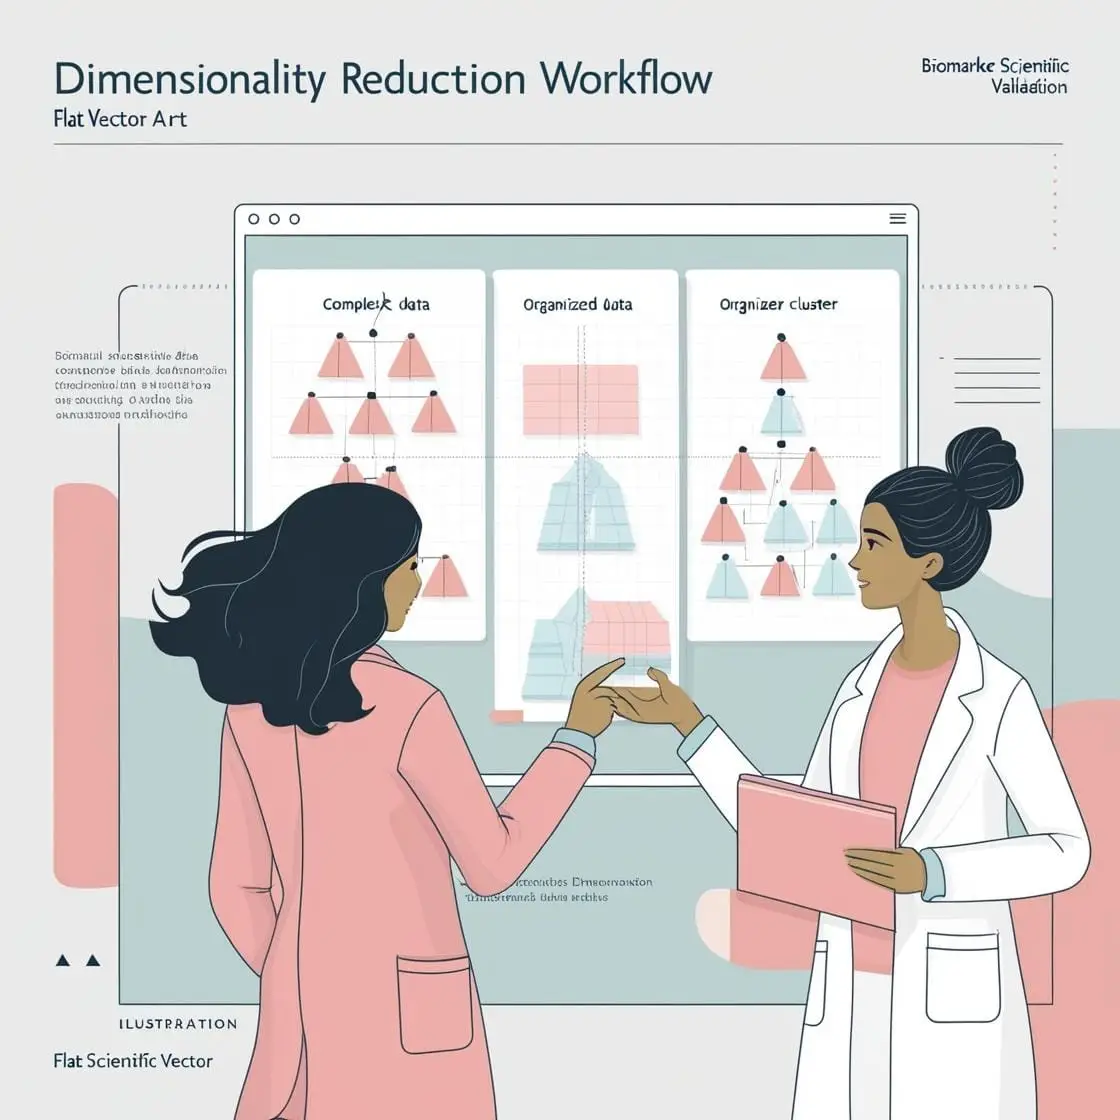
12
Dimensionality Reduction (UMAP, tSNE)
Updated May 2026
→
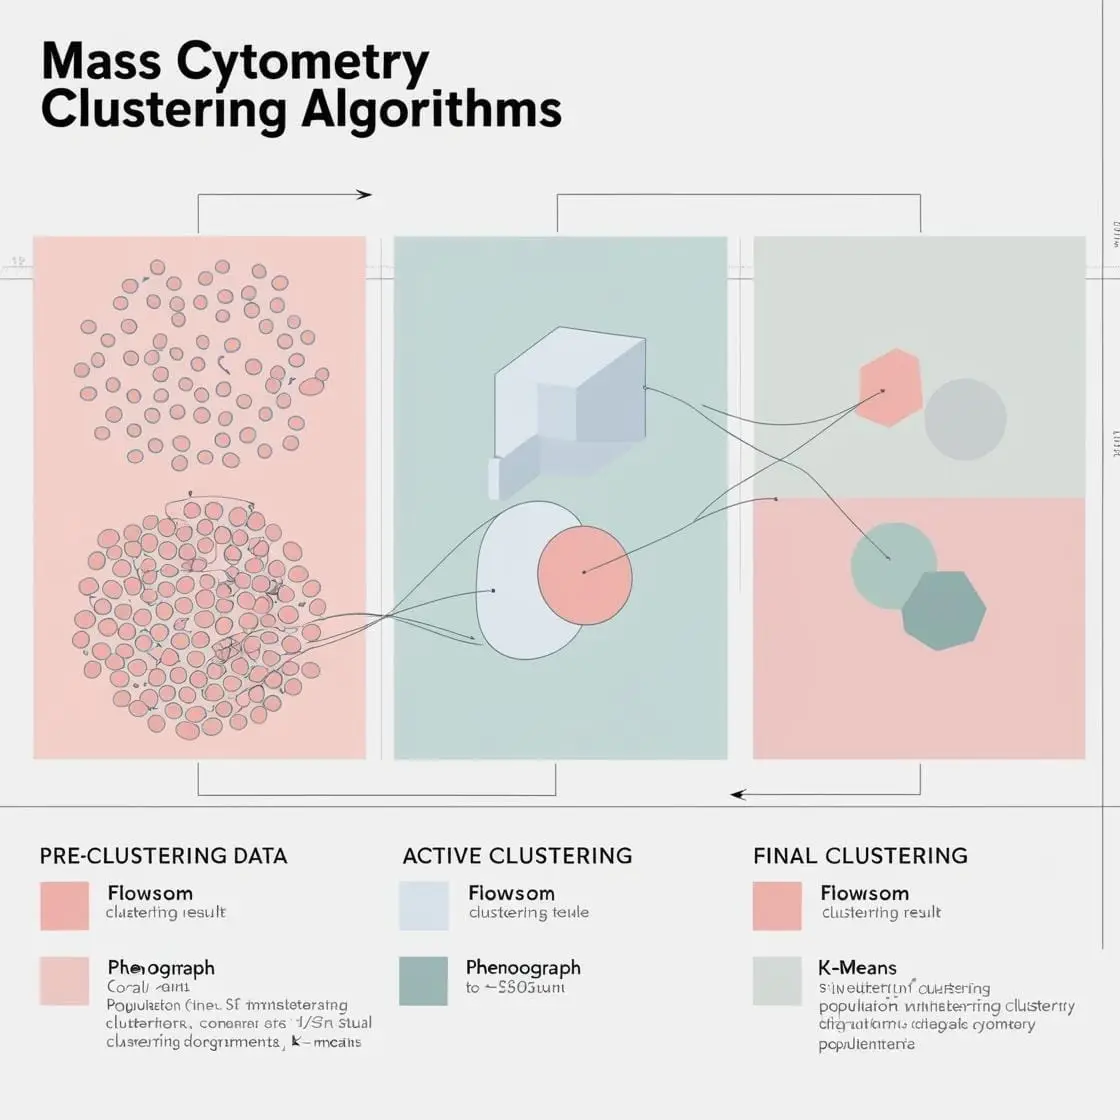
13
Clustering Algorithms (FlowSOM, PhenoGraph)
Updated May 2026
→
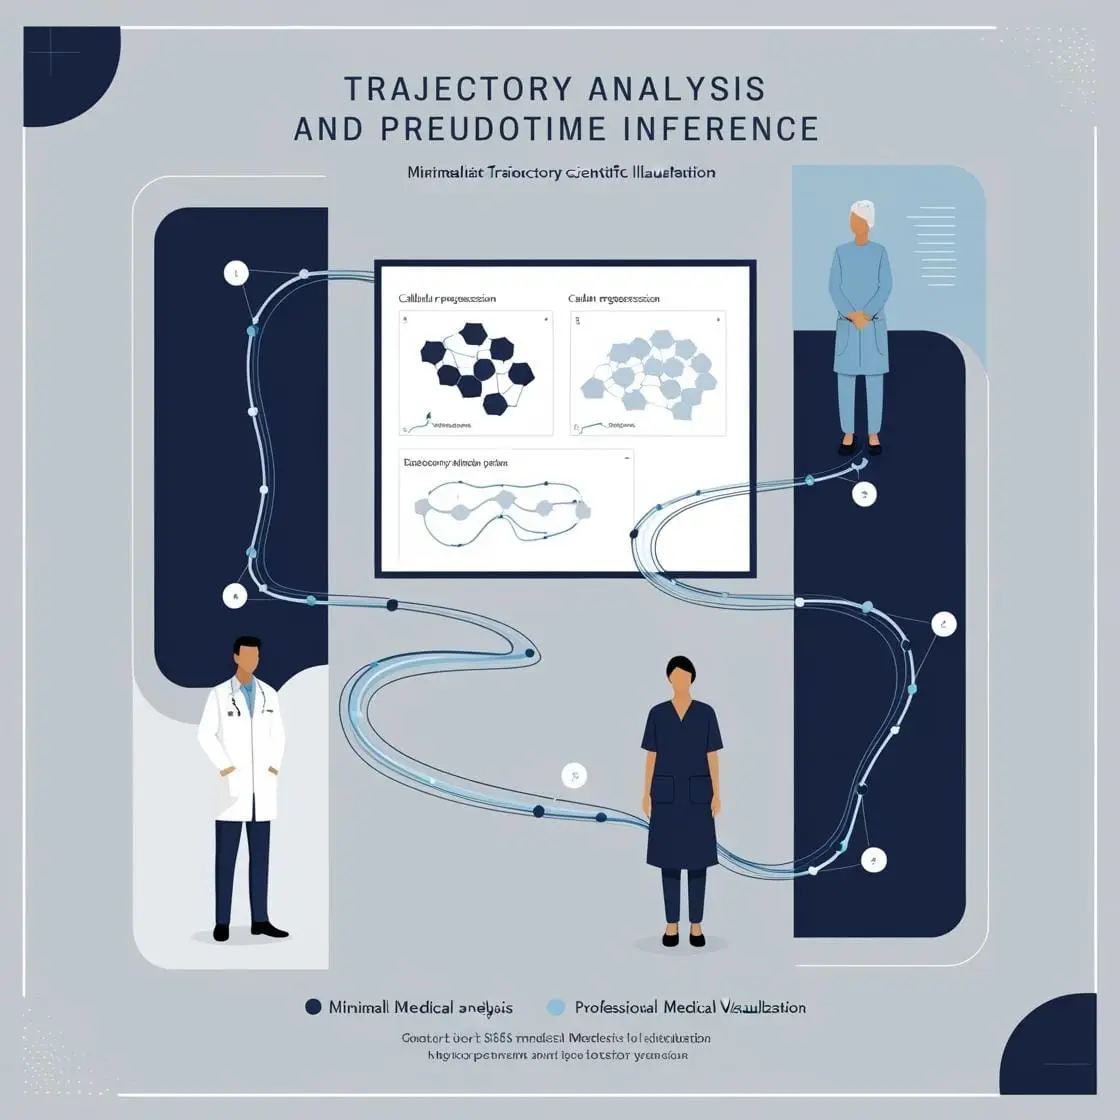
14
Trajectory Analysis & Pseudotime
Updated May 2026
→
15
Machine Learning Applications
Updated May 2026
→
Part III
Clinical Applications
16
Tumor Heterogeneity
Updated May 2026
→
17
Immunophenotyping in Hematology
Updated May 2026
→
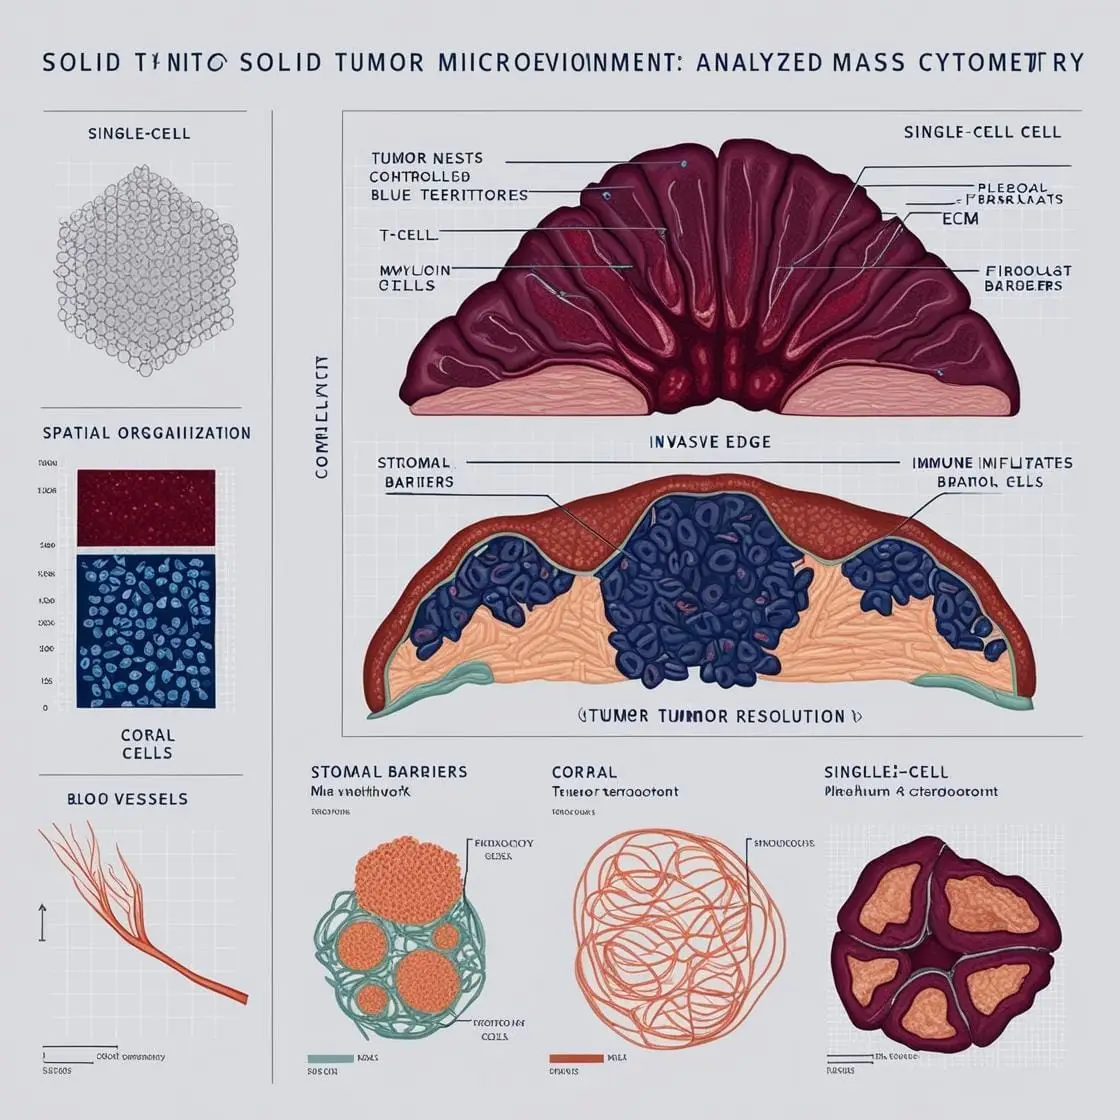
18
Solid Tumor Microenvironment
Updated May 2026
→
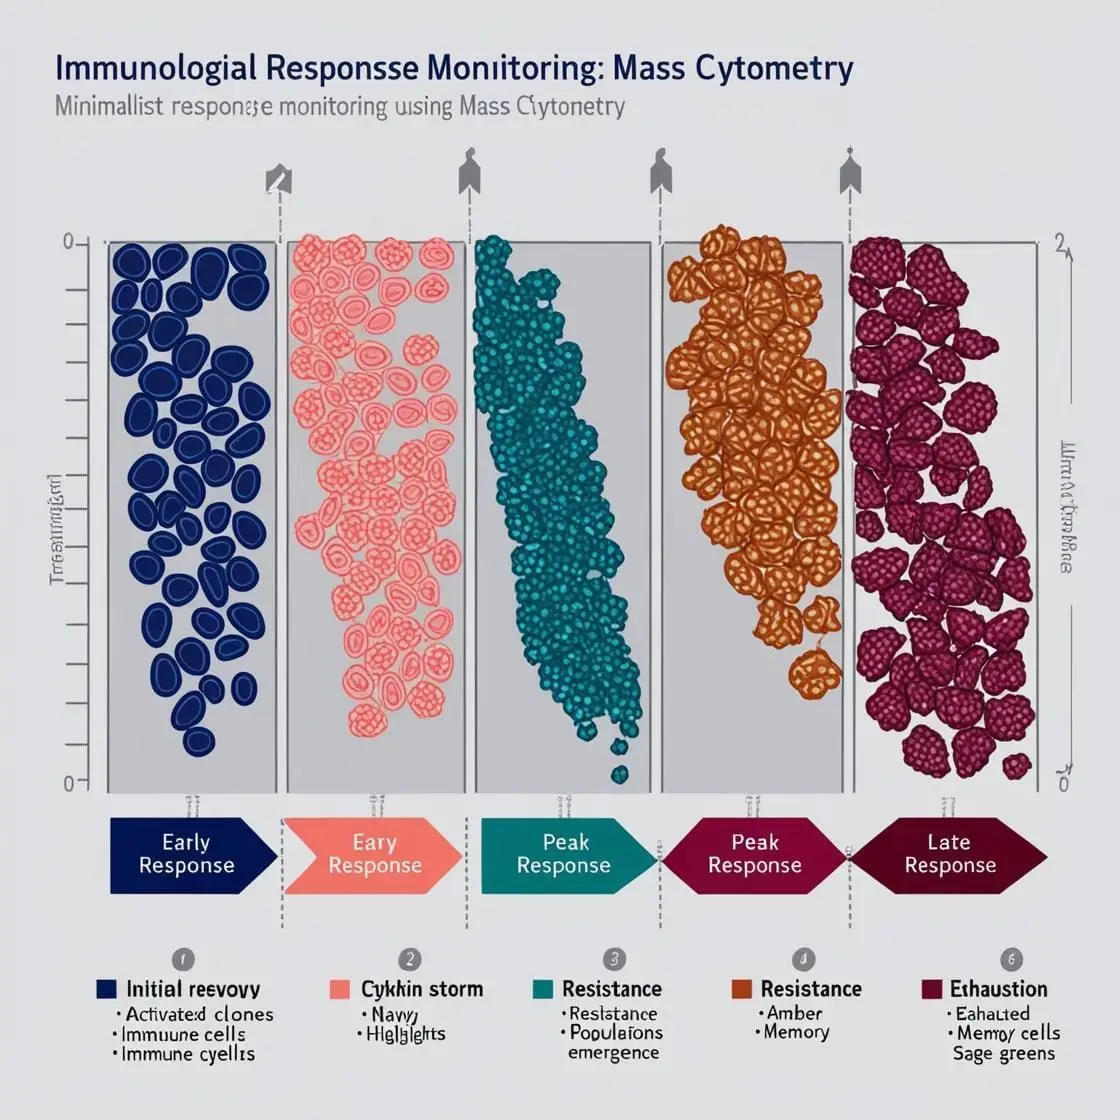
19
Monitoring Immunological Response
Updated May 2026
→
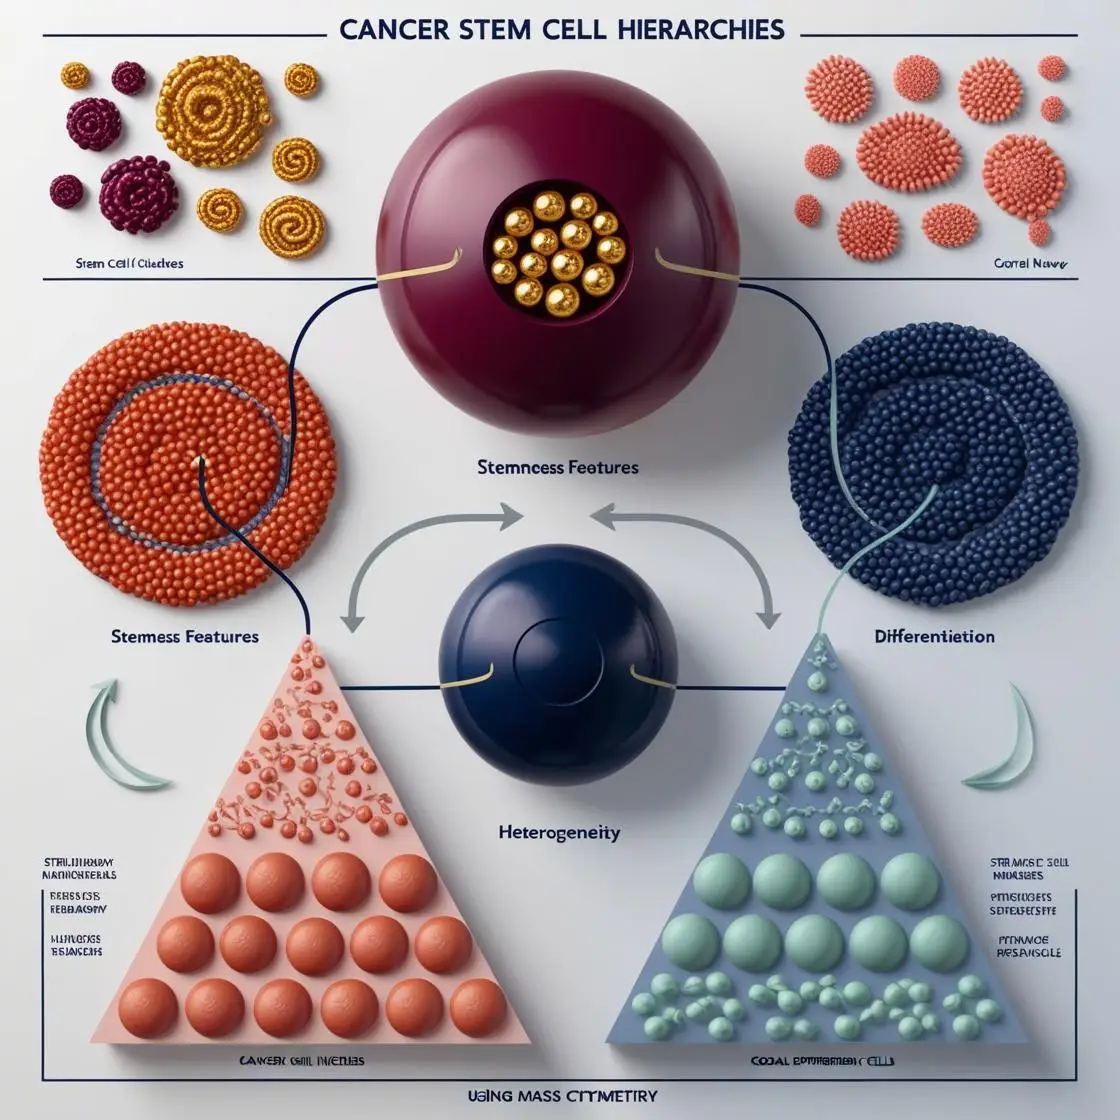
20
Cancer Stem Cells & Hierarchies
Updated May 2026
→
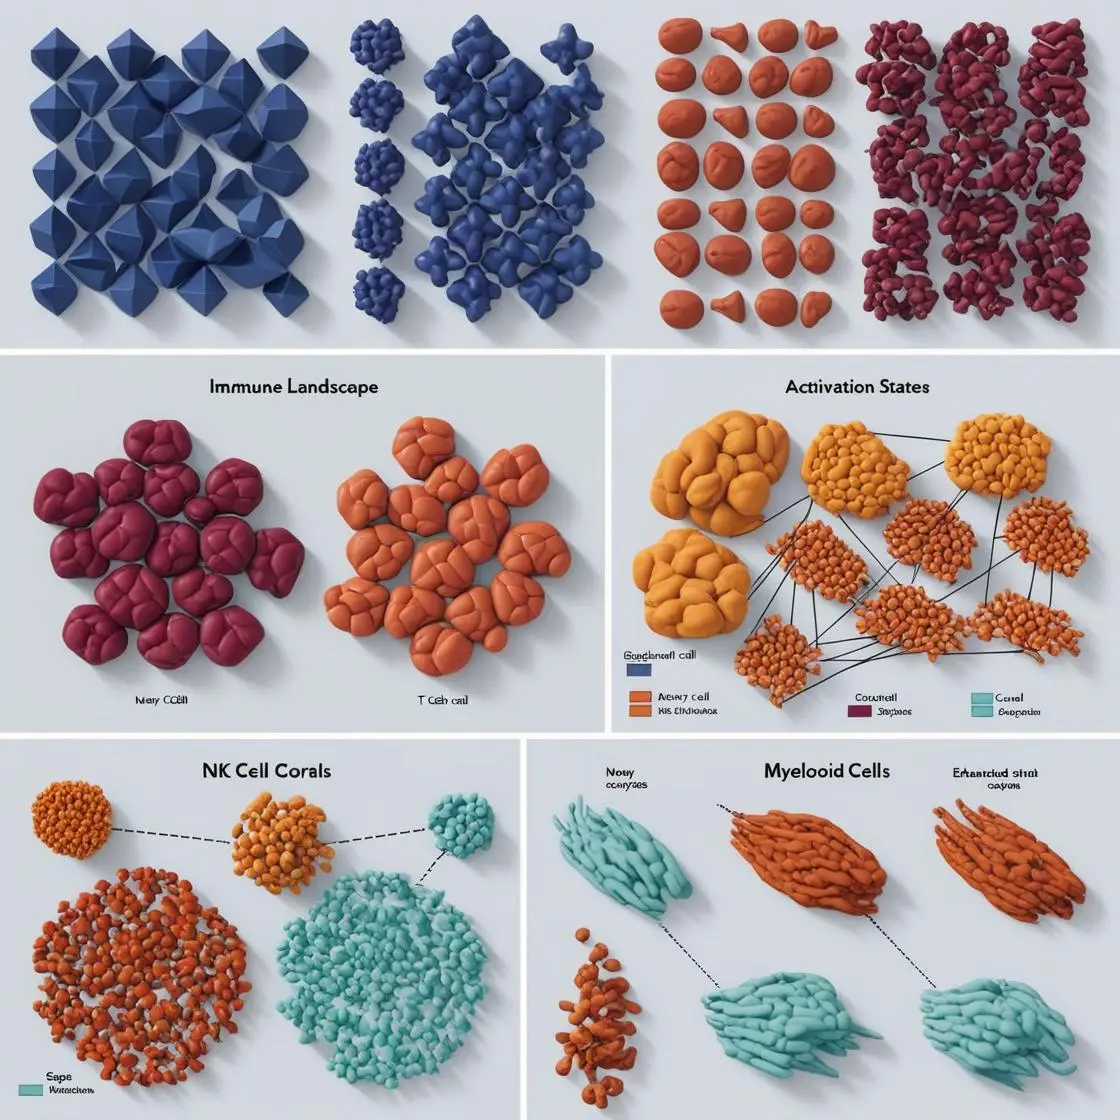
21
Comprehensive Immune Profiling
Updated May 2026
→
22
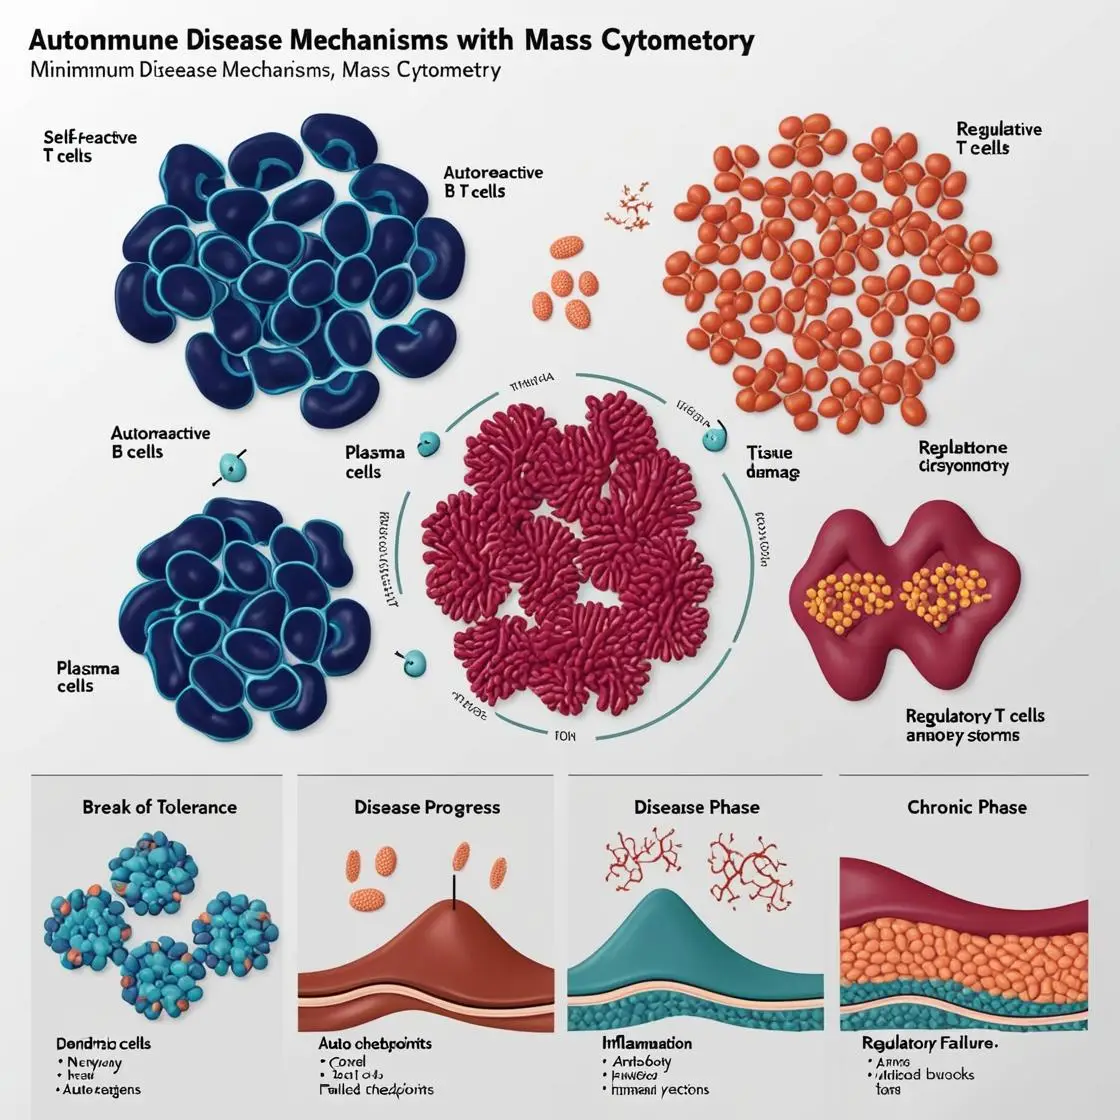
Autoimmune Disease Mechanisms
Updated May 2026
→
23
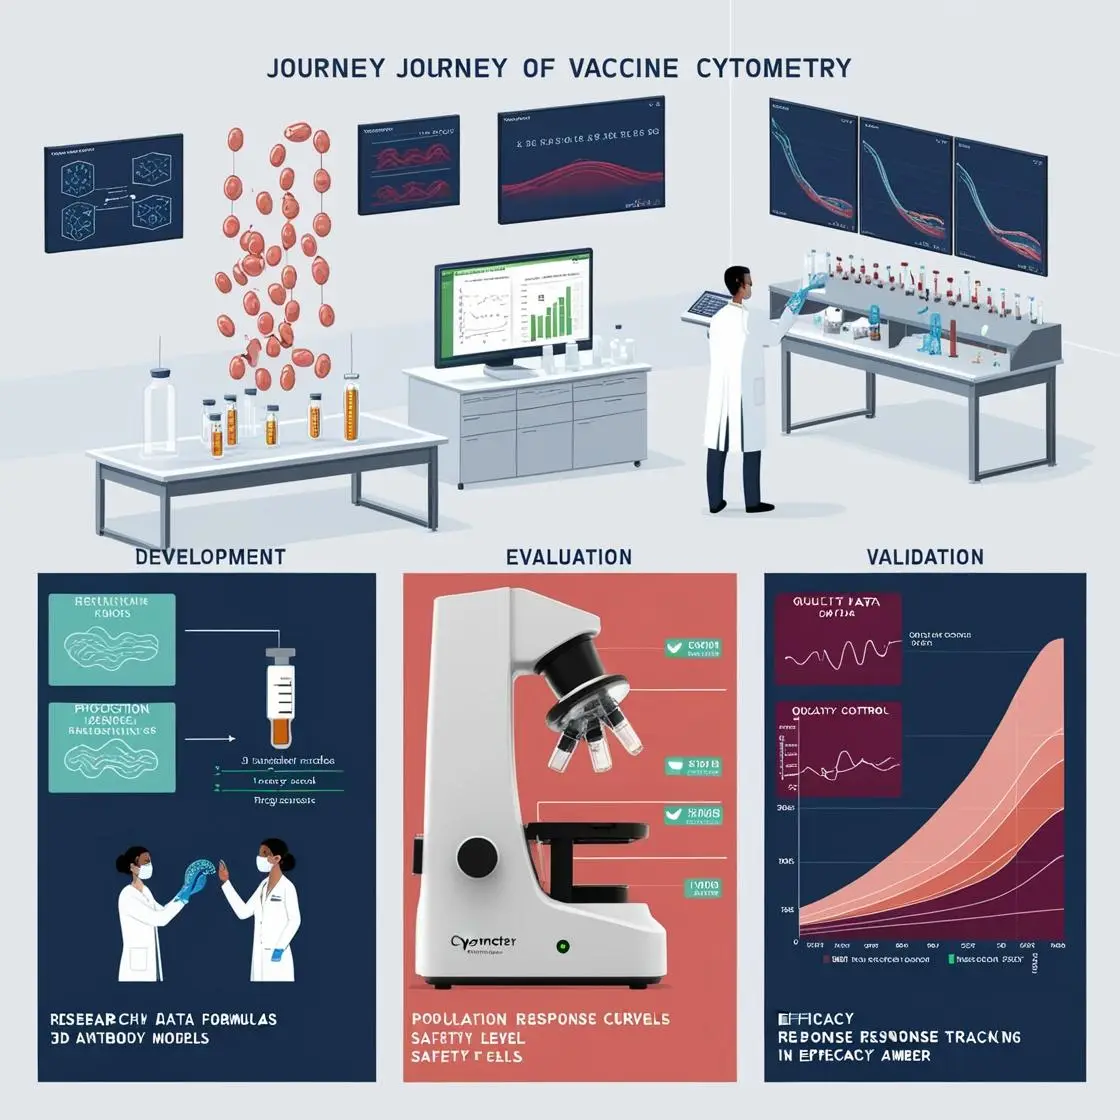
Vaccine Development & Evaluation
Updated May 2026
→
24
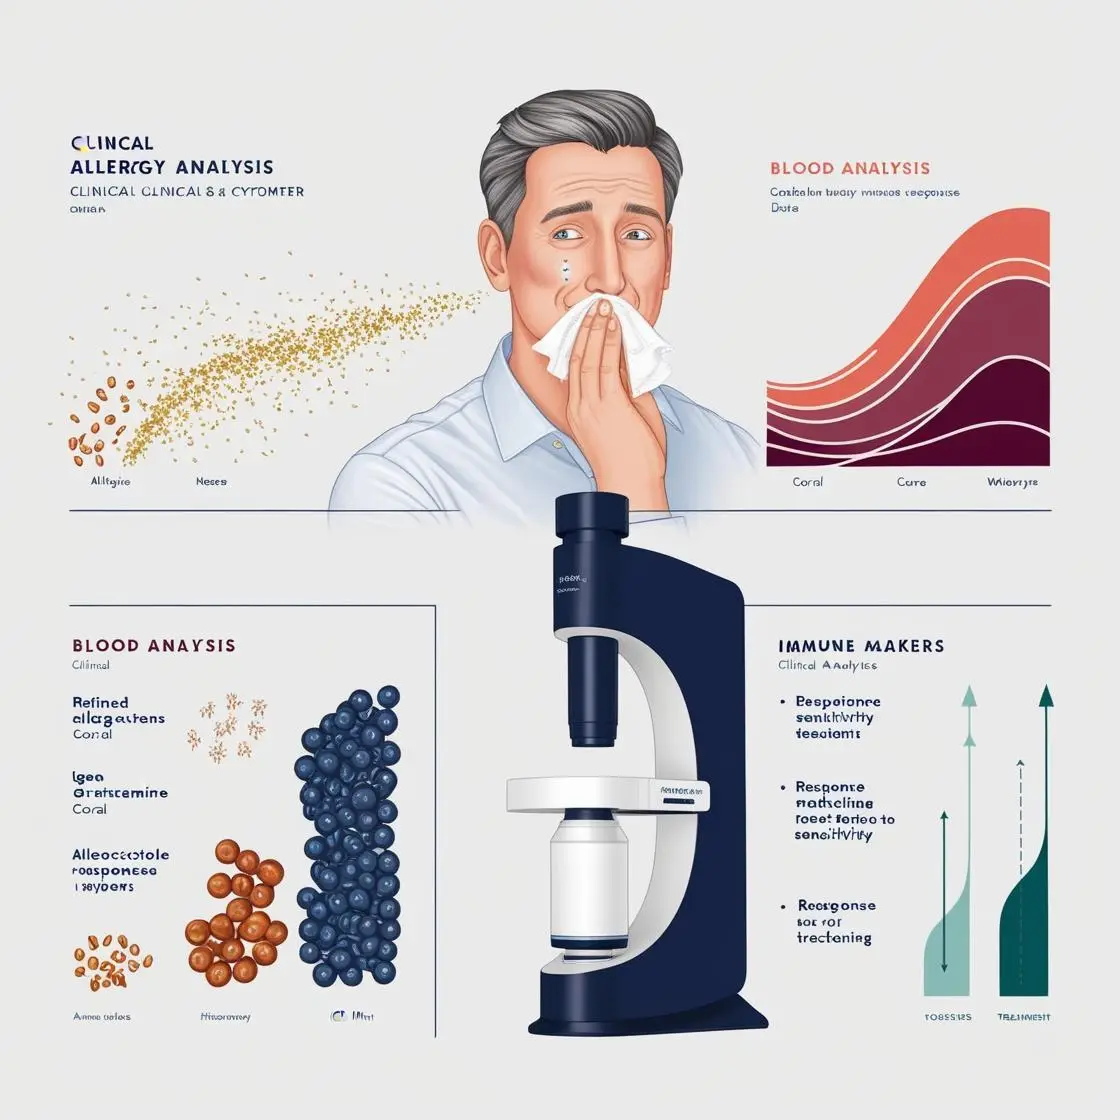
Allergy & Hypersensitivity
Updated May 2026
→
25
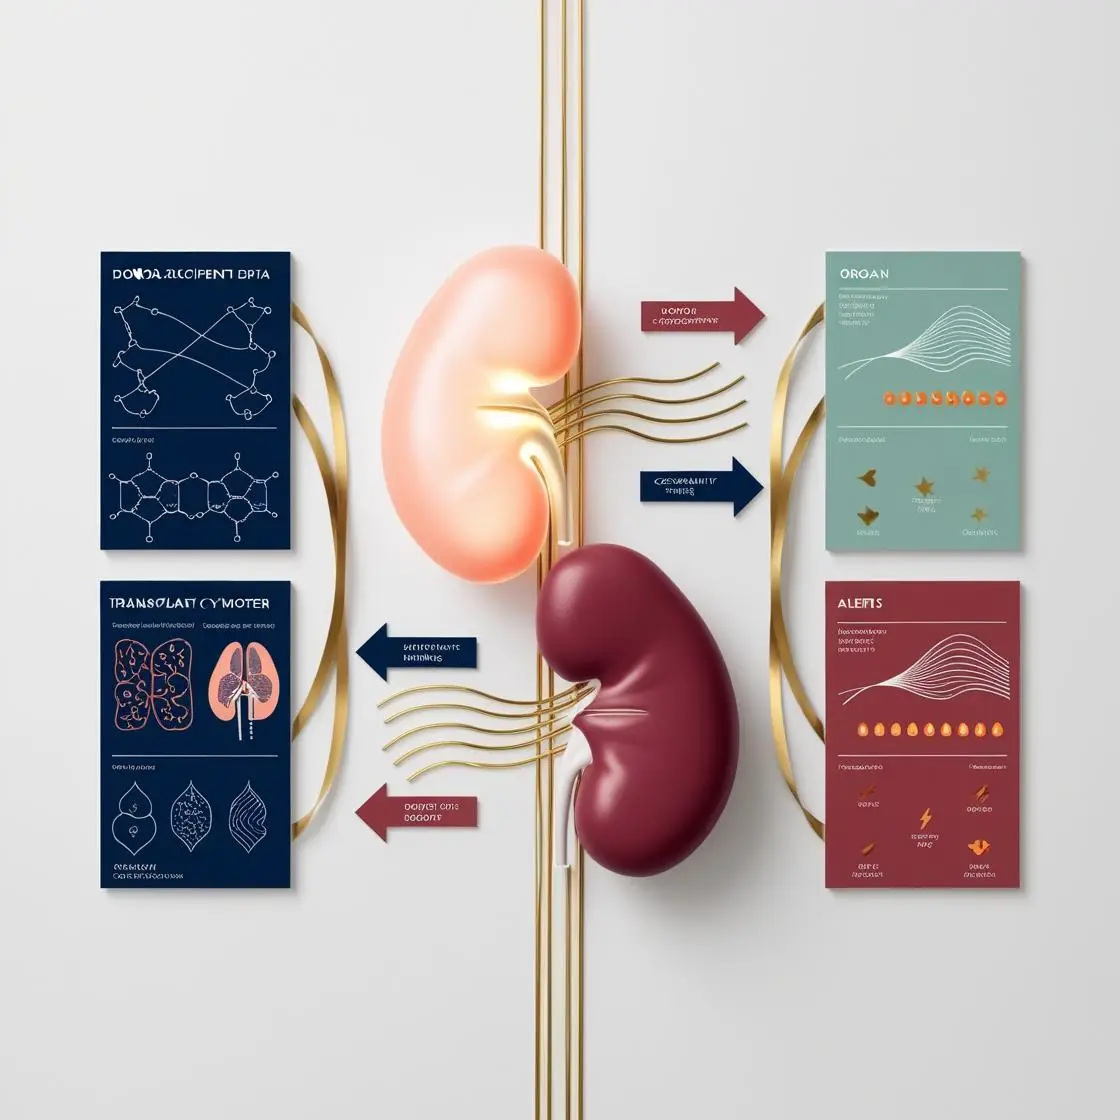
Transplantation Immunology
Updated May 2026
→
26
Neurodegenerative Diseases
Updated May 2026
→
27
Cardiovascular Disease
Updated May 2026
→
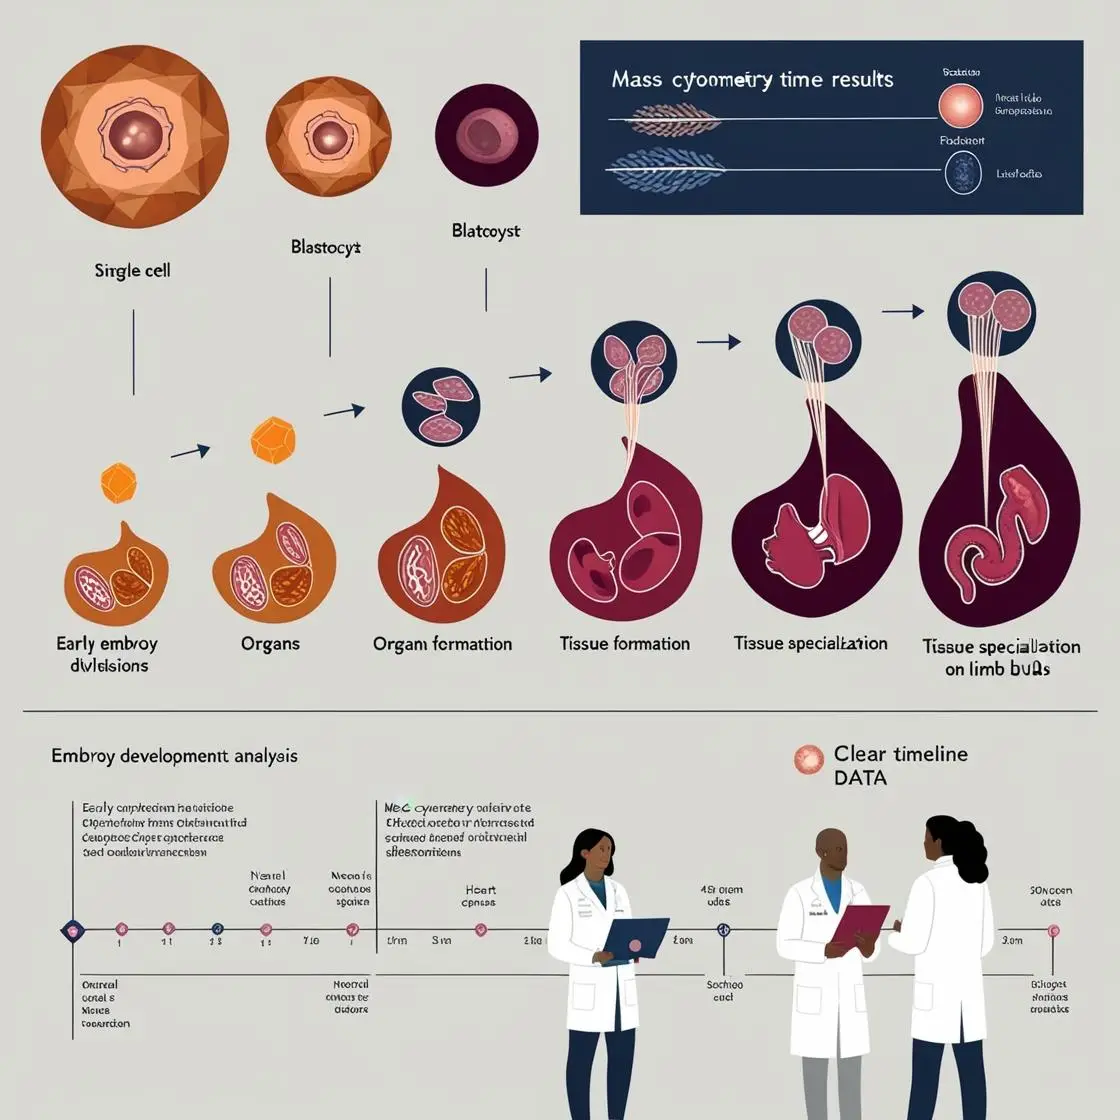
28
Reproductive Medicine & Fetal Development
Updated May 2026
→
29
Infectious Diseases
Updated May 2026
→
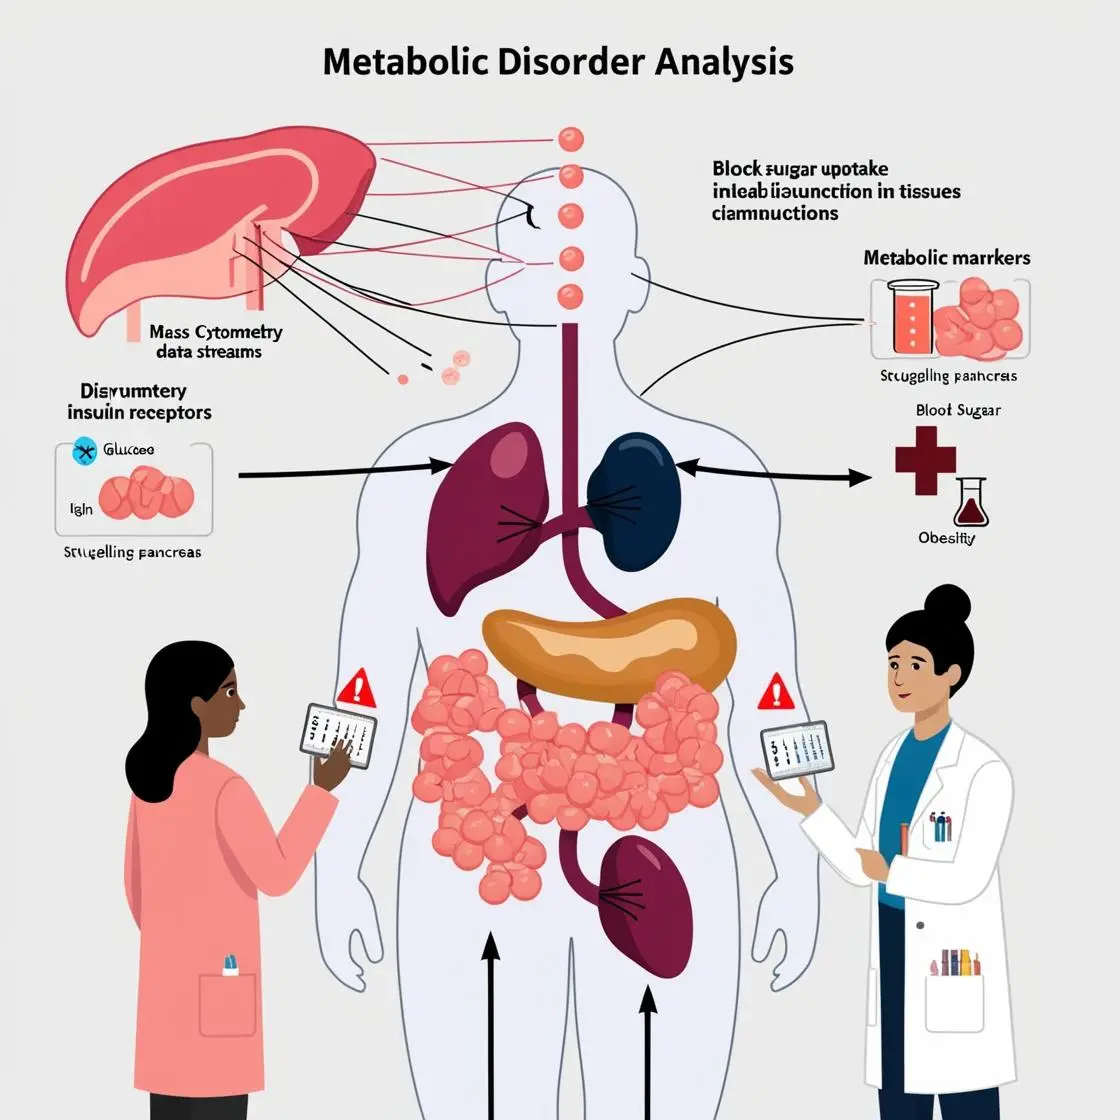
30
Metabolic Disorders
Updated May 2026
→
Part IV
Advanced Topics
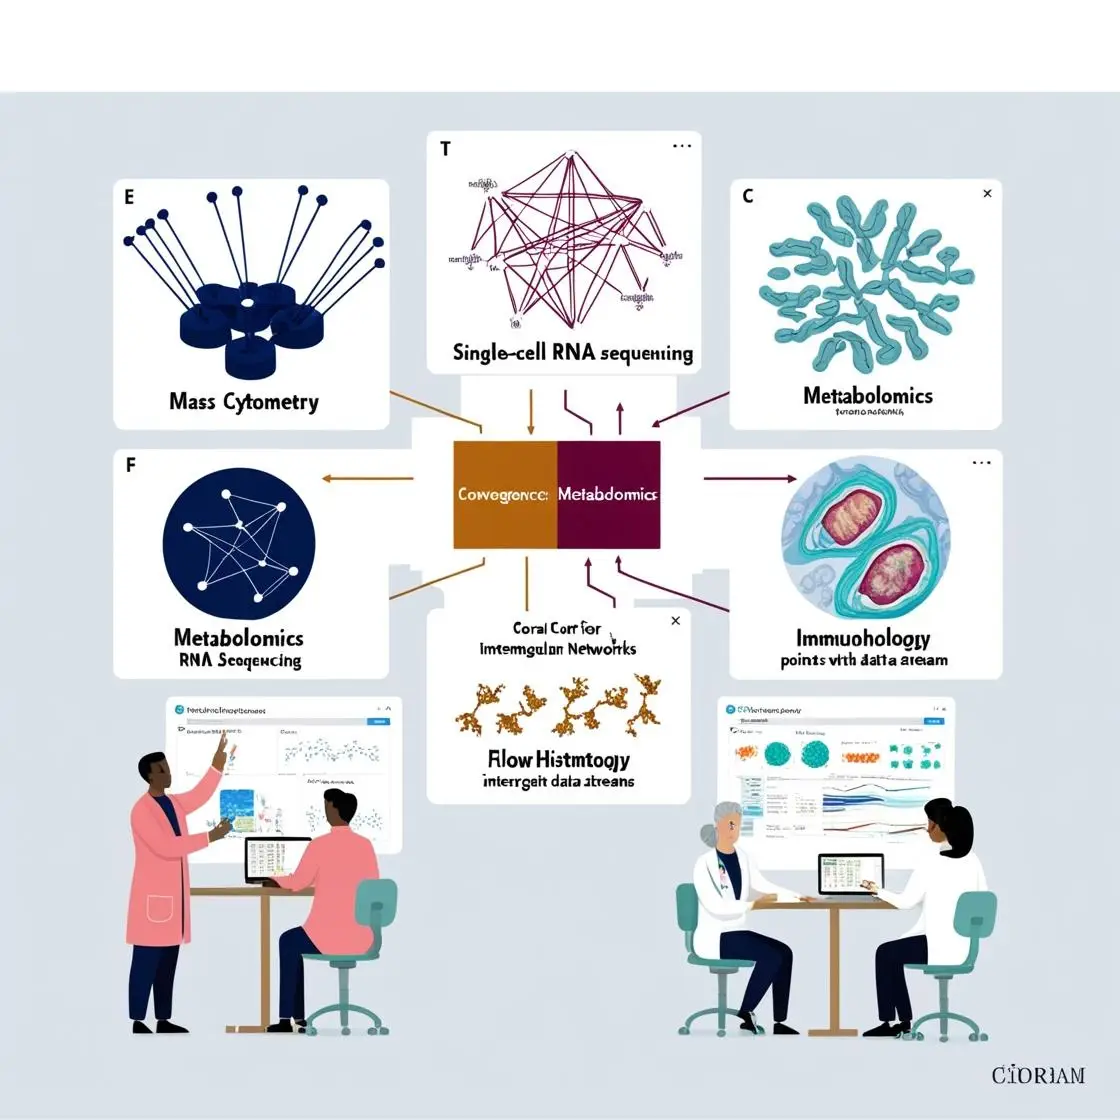
31
Integration with Other Omics Technologies
Updated May 2026
→
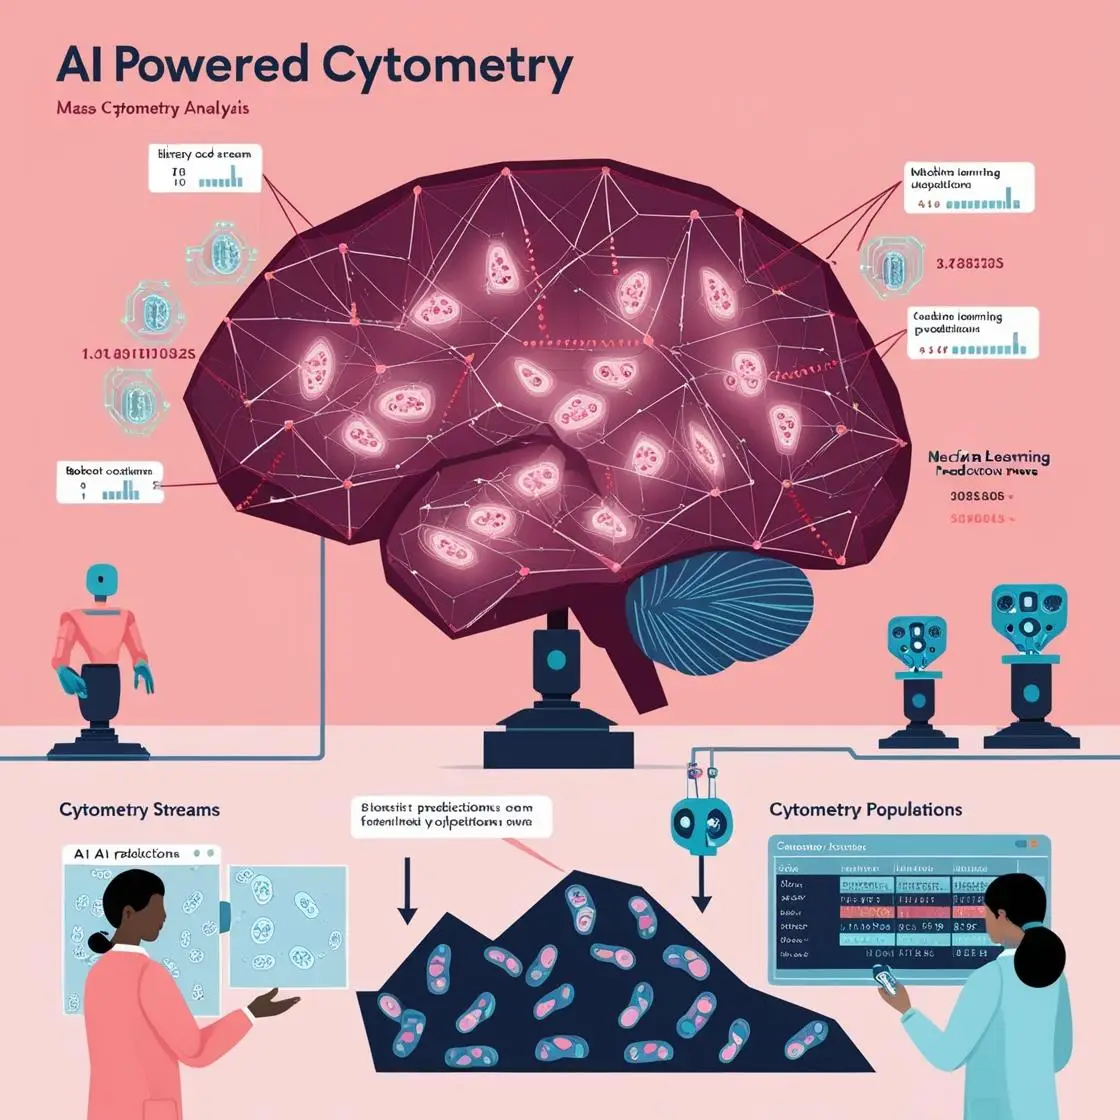
32
Artificial Intelligence & Mass Cytometry
Updated May 2026
→
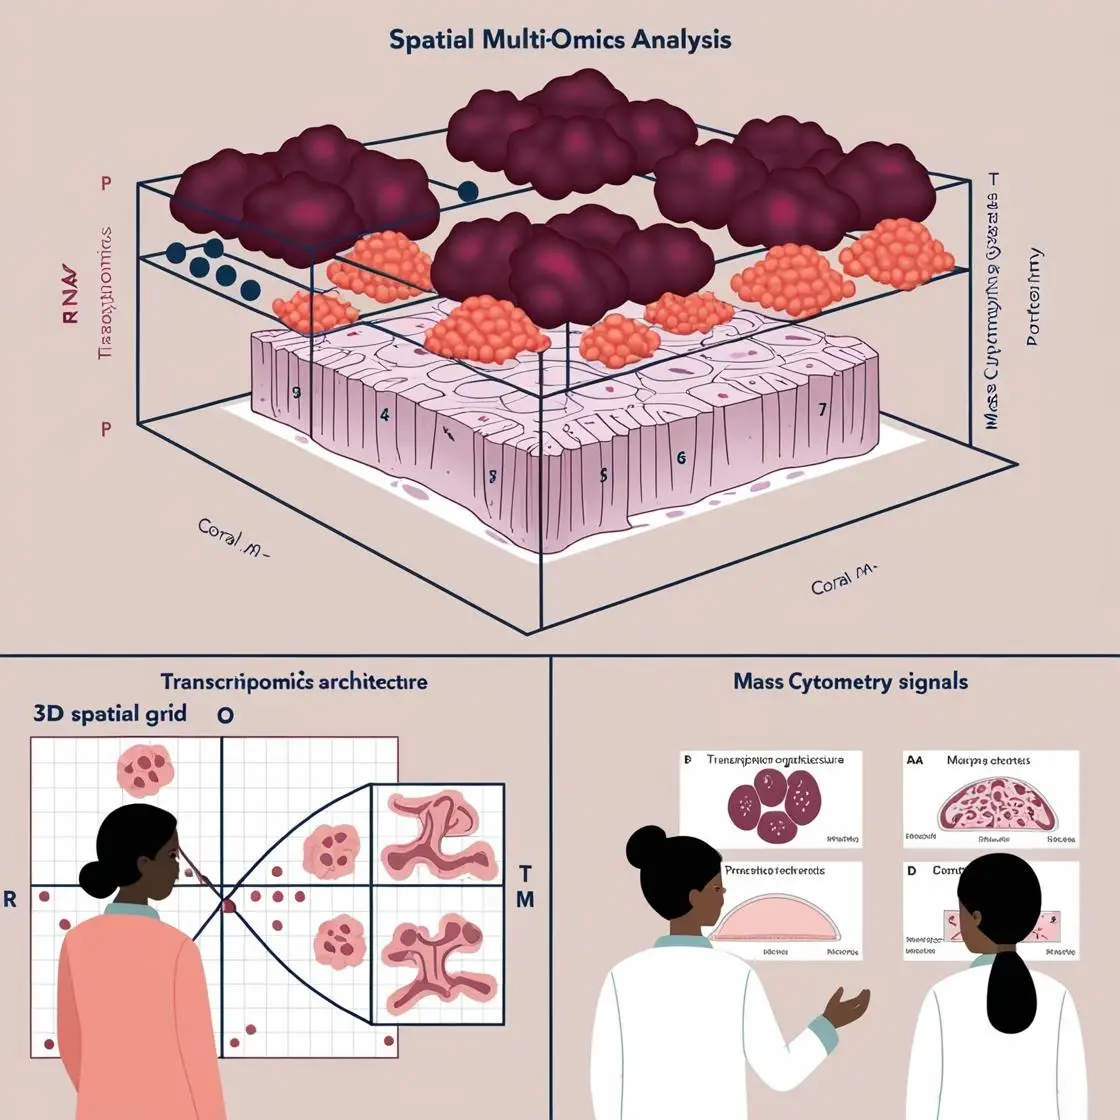
33
Spatial Transcriptomics & Proteomics
Updated May 2026
→
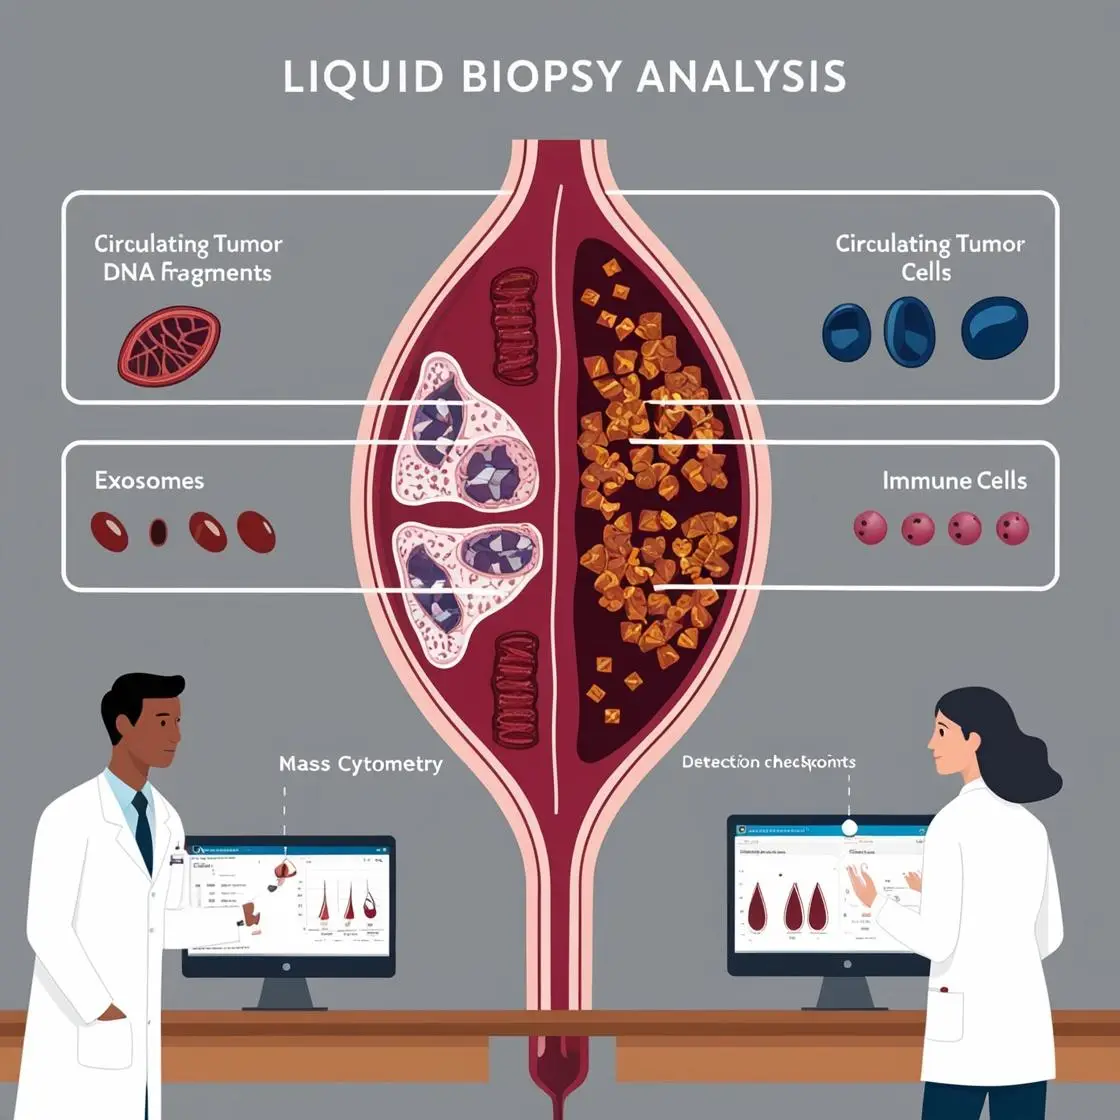
34
Liquid Biopsies & Circulating Biomarkers
Updated May 2026
→
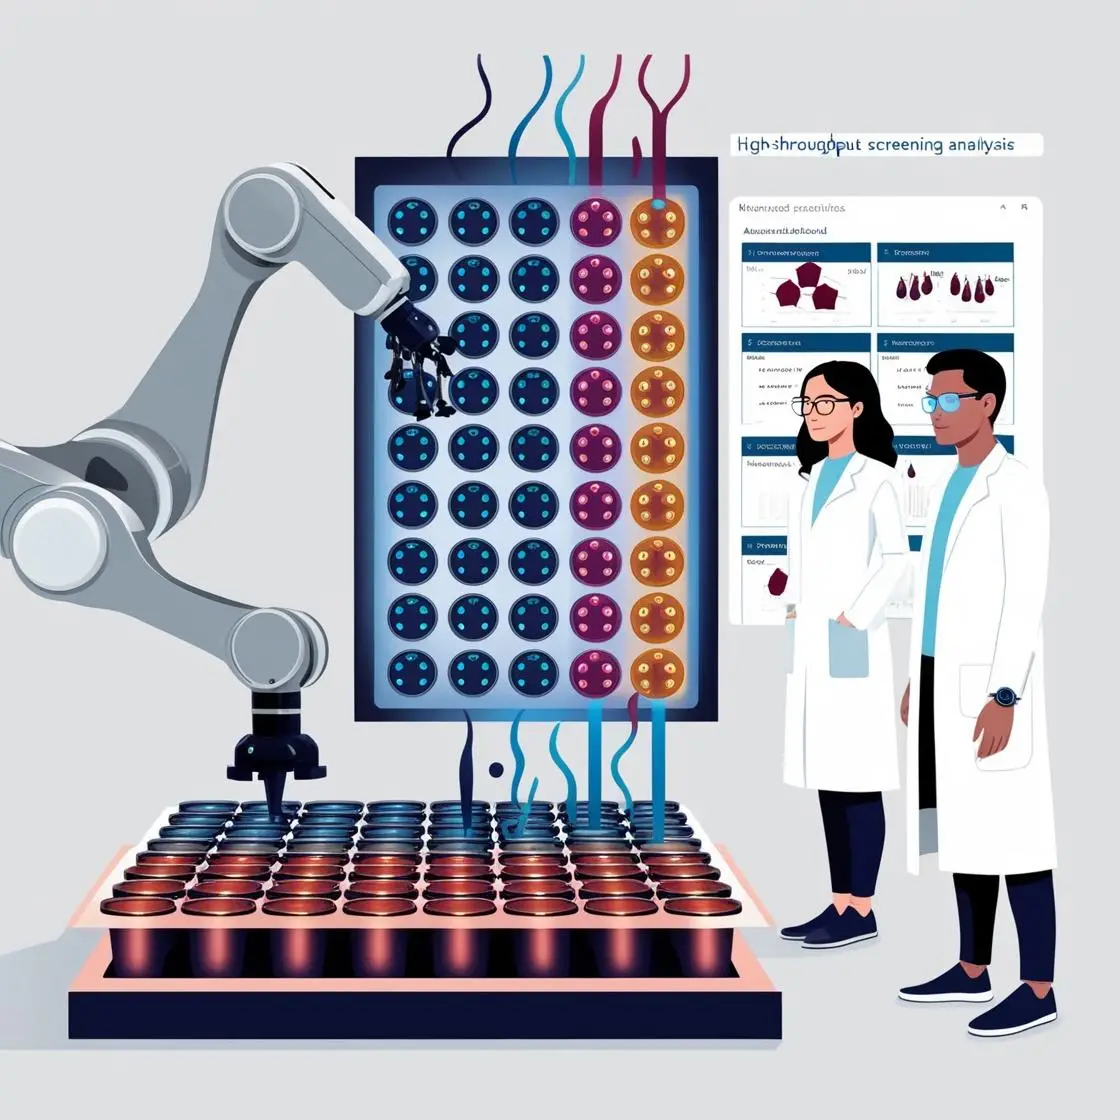
35
High-Throughput Drug Screening
Updated May 2026
→
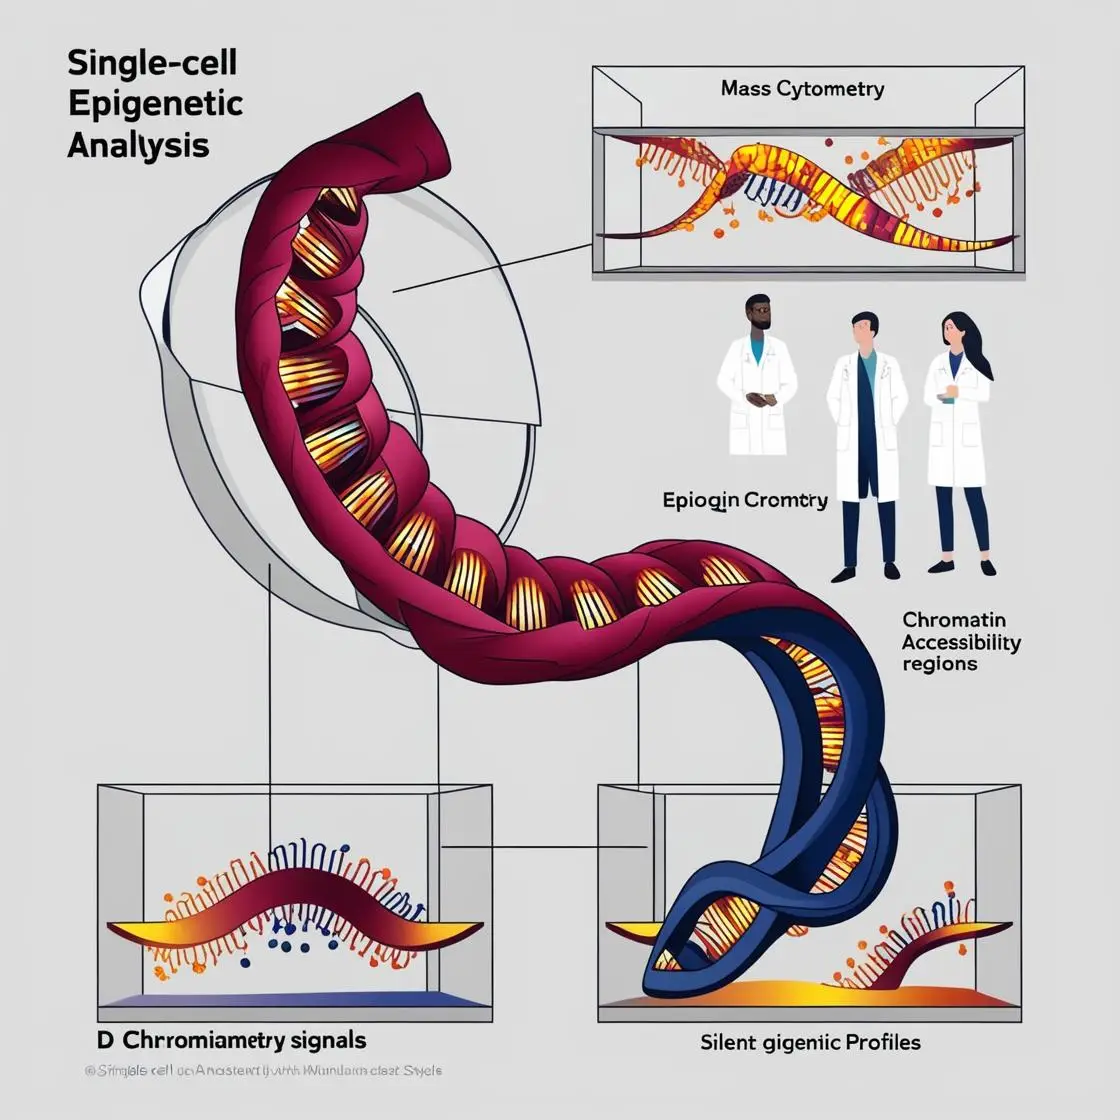
36
Epigenetic Profiling at Single-Cell Level
Updated May 2026
→
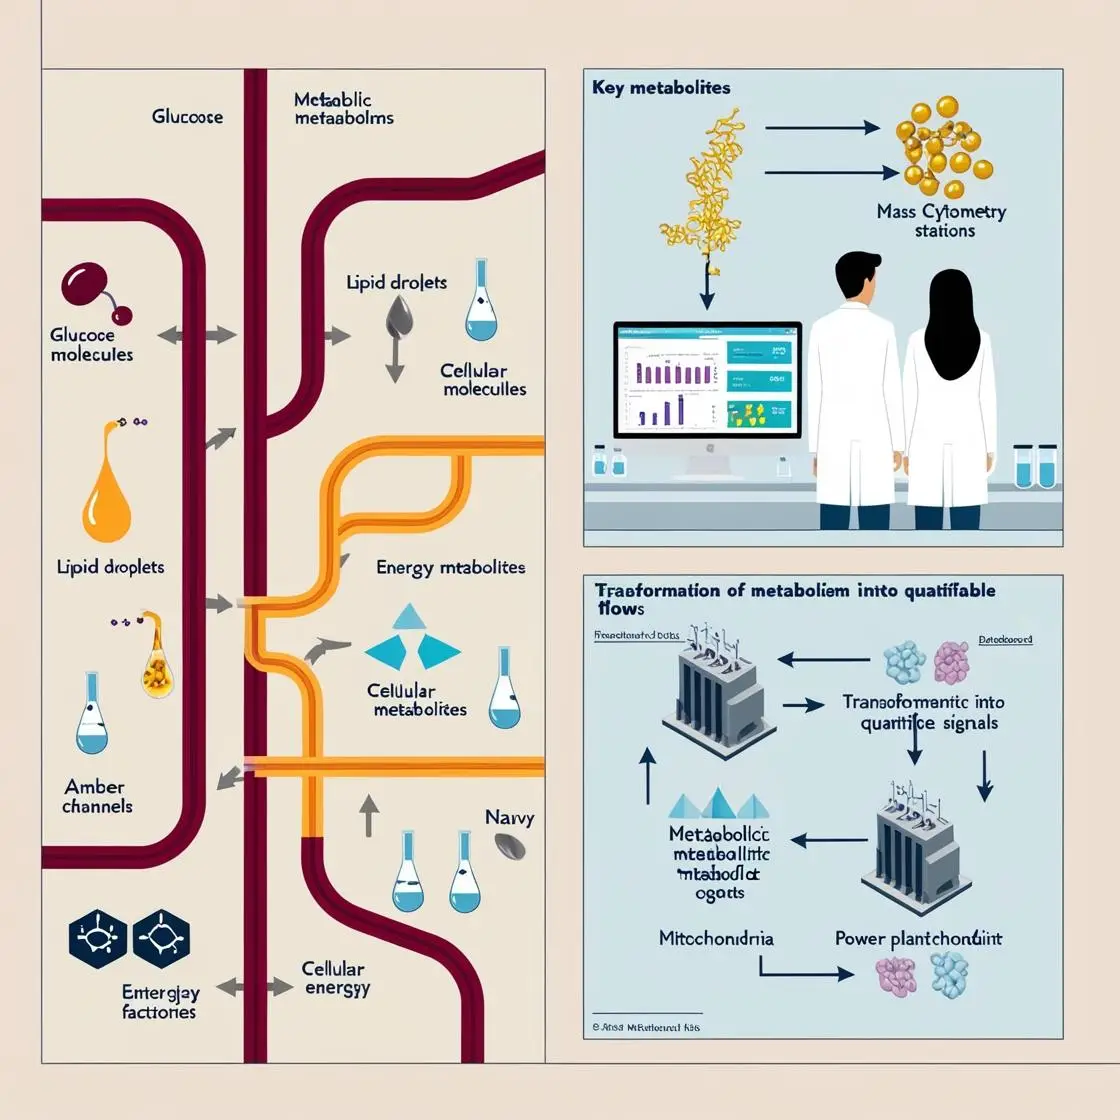
37
Metabolomics & Mass Cytometry
Updated May 2026
→
38
Mass Cytometry in Developmental Biology
Updated May 2026
→
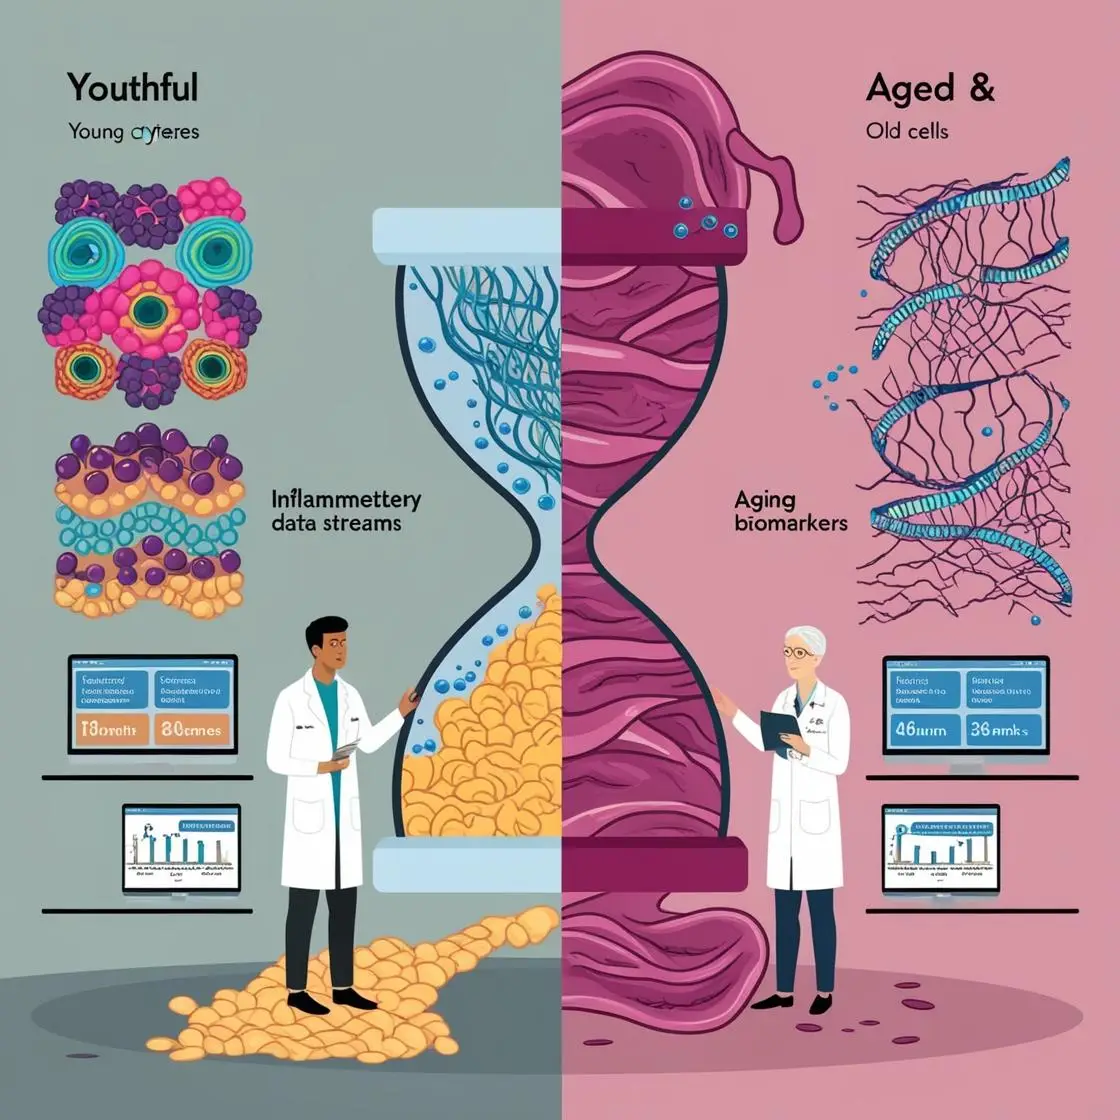
39
Aging & Senescence
Updated May 2026
→
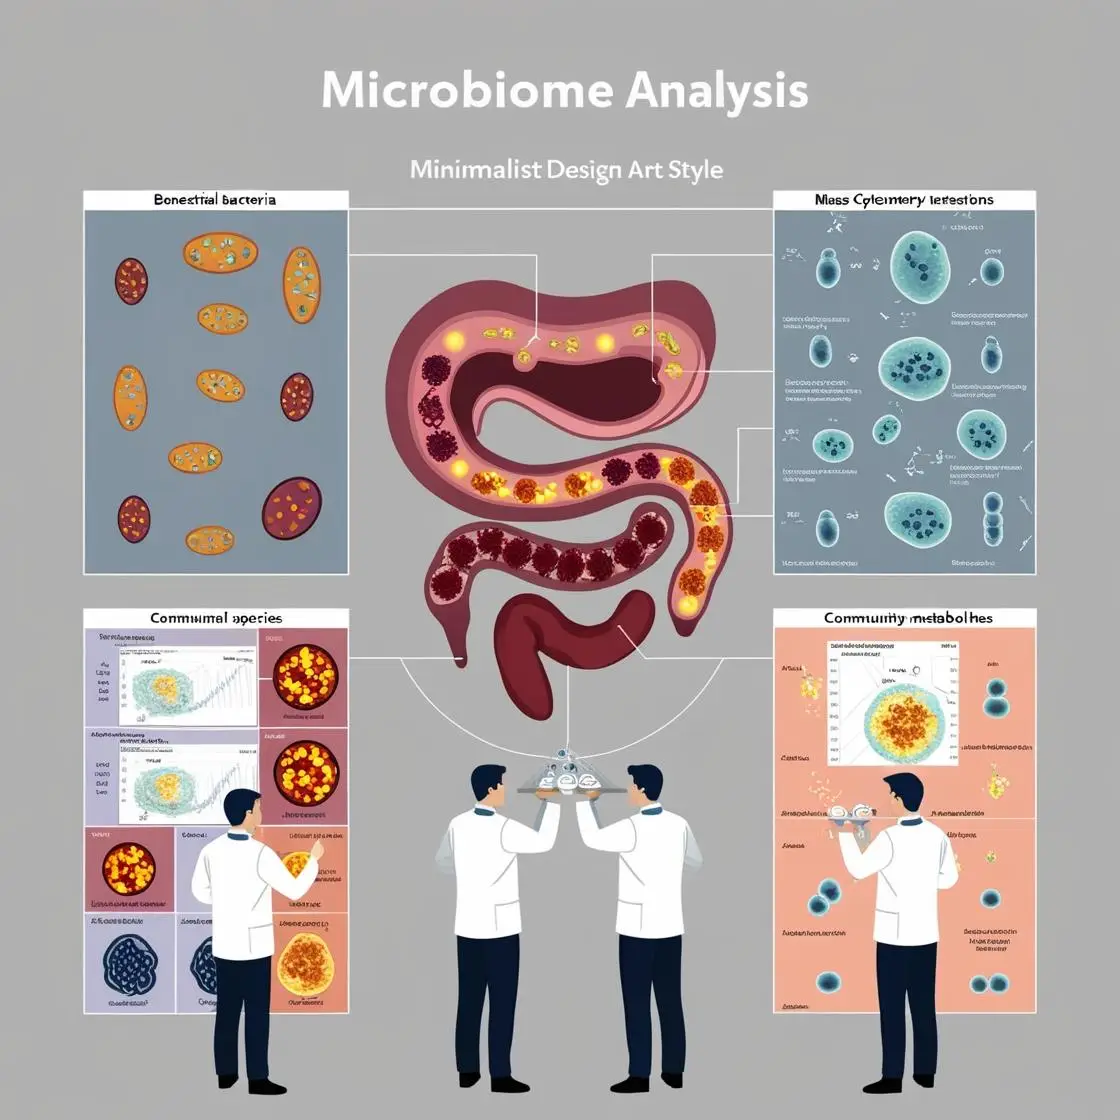
40
Mass Cytometry in Microbiome Research
Updated May 2026
→
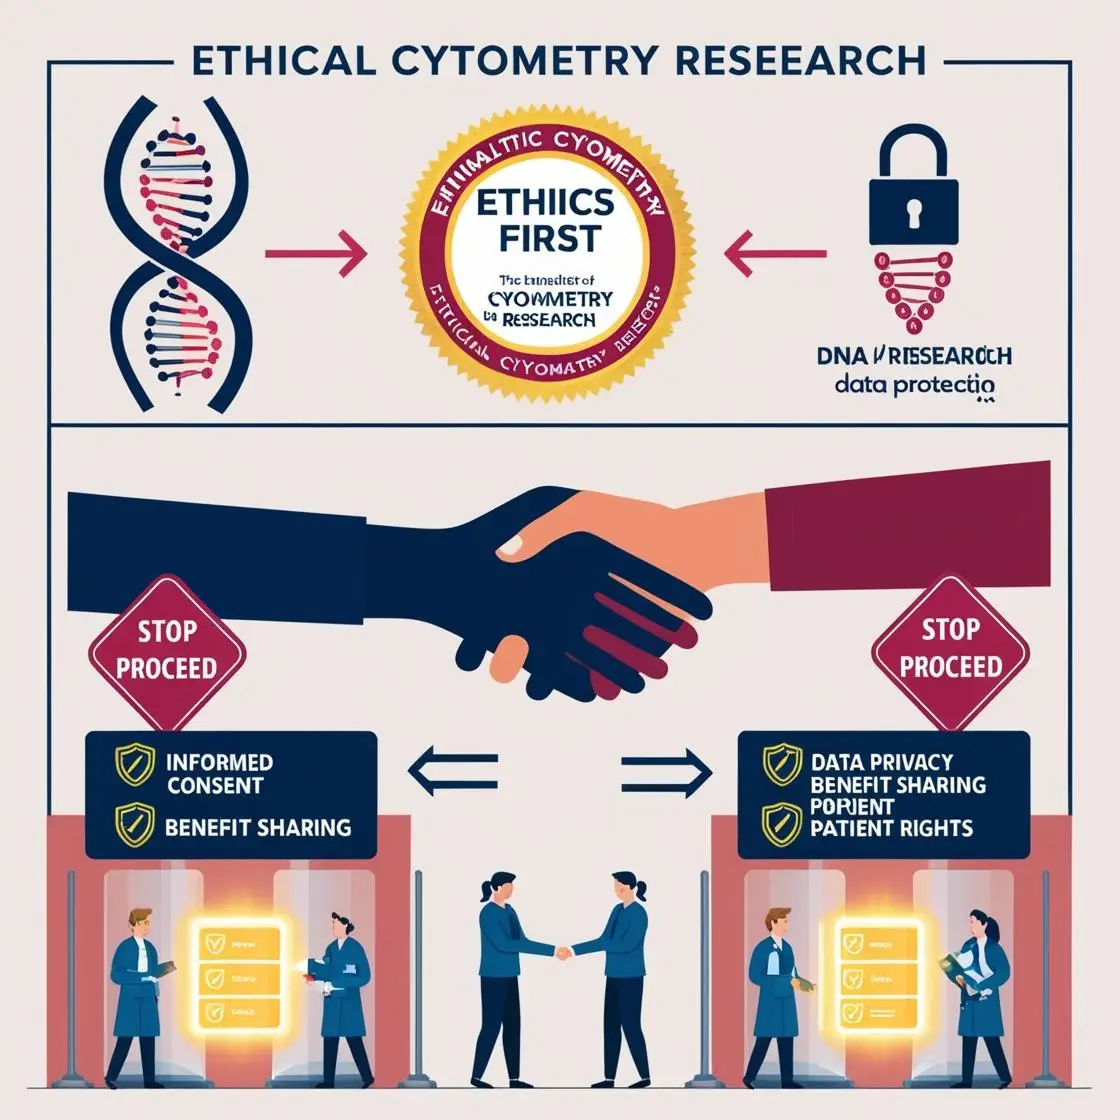
41
Ethical Considerations & Conclusion
Updated May 2026
→
42
Integrating Claude AI, R & Chronulus
Updated May 2026
→